class: center, middle # Evaluating Fit Linear Models <br>  --- # Putting Linear Regression Into Practice with Pufferfish .pull-left[ - Pufferfish are toxic/harmful to predators <br> - Batesian mimics gain protection from predation - why? <br><br> - Evolved response to appearance? <br><br> - Researchers tested with mimics varying in toxic pufferfish resemblance ] .pull-right[ 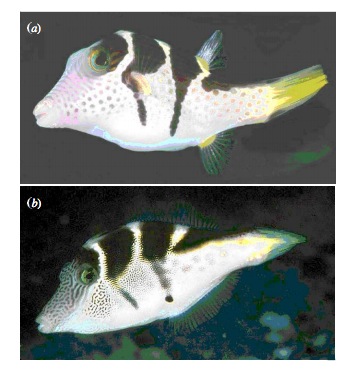 ] --- ## Question of the day: Does Resembling a Pufferfish Reduce Predator Visits? <img src="linear_regression_details_files/figure-html/puffershow-1.png" style="display: block; margin: auto;" /> --- # Digging Deeper into Regression 1. Assumptions: Is our fit valid? 2. How did we fit this model? --- # You are now a Statistical Wizard. Be Careful. Your Model is a Golem. (sensu Richard McElreath) .center[.middle[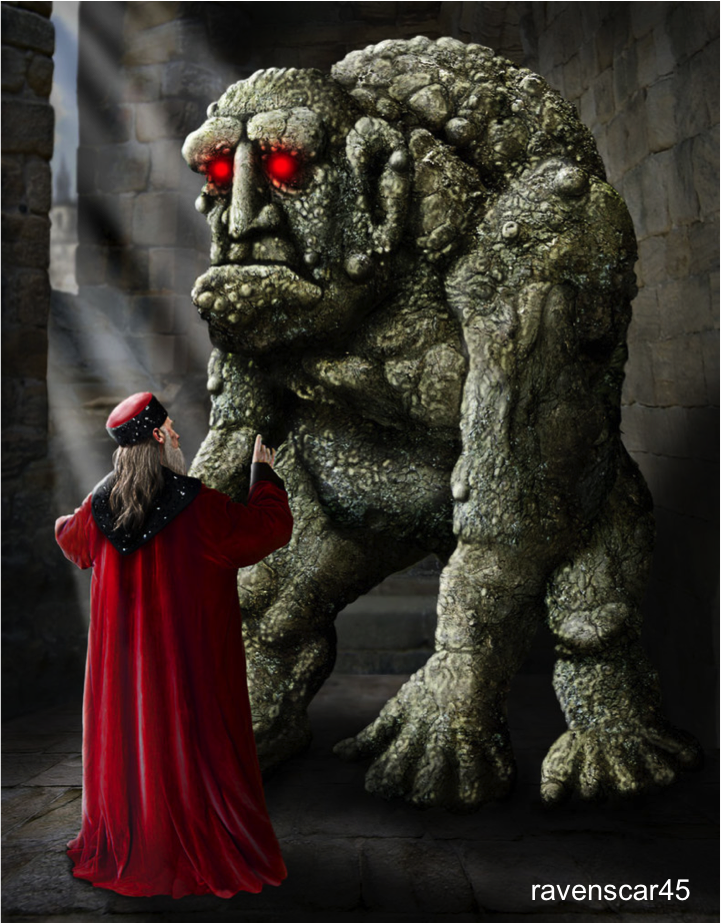]] --- # A Case of "Great" versus "Not as Great" Fits... .pull-left[  ] .pull-right[ 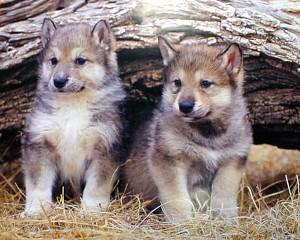 ] --- # The Two Fits .pull-left[ <br><br> <img src="linear_regression_details_files/figure-html/puffershow-1.png" style="display: block; margin: auto;" /> ] .pull-right[ <br><br> <img src="linear_regression_details_files/figure-html/wolf_scatterplot-1.png" style="display: block; margin: auto;" /> ] --- # Assumptions (in rough descending order of importance) 1. Validity 2. Representativeness 3. Model captures features in the data 4. Additivity and Linearity 5. Independence of Errors 6. Equal Variance of Errors 7. Normality of Errors 8. Minimal Outlier Influence --- # Validity: Do X and Y Reflect Concepts I'm interested In <img src="linear_regression_details_files/figure-html/puffershow-1.png" style="display: block; margin: auto;" /> What if predator approaches is not a good measure of recognition? Or mimics just don't look like fish? --- class: middle # Solution to lack of validity: ## Reframe your question! Change your framing! Question your life choices! --- # Representativeness: Does Your Data Represent the Population? #### For example, say this is your result... <img src="linear_regression_details_files/figure-html/predictionRange1-1.png" style="display: block; margin: auto;" /> --- class: center, middle # But is that all there is to X in nature? --- # Representativeness: Does Your Data Represent the Population? #### What if you are looking at only a piece of the variation in X in your population? <img src="linear_regression_details_files/figure-html/predRange2-1.png" style="display: block; margin: auto;" /> --- # Representativeness: Does Your Data Represent the Population? #### How should you have sampled this population for a representative result? <img src="linear_regression_details_files/figure-html/PredictionRange3-1.png" style="display: block; margin: auto;" /> --- # Representativeness: Does Your Data Represent the Population? #### It's better to have more variation in X than just a bigger N <img src="linear_regression_details_files/figure-html/predRange4-1.png" style="display: block; margin: auto;" /> --- # Representativeness: Does Your Data Represent the Population? - Always question if you did a good job sampling - Use natural history and the literature to get the bounds of values - If experimenting, make sure your treatment levels are representative - If you realize post-hoc they are not, **qualify your conclusions** --- # Model captures features in the data <img src="linear_regression_details_files/figure-html/puffershow-1.png" style="display: block; margin: auto;" /> Does the model seem to fit the data? Are there any deviations? Can be hard to see... --- # Simulating implications from the model to see if we match features in the data <img src="linear_regression_details_files/figure-html/sims-1.png" style="display: block; margin: auto;" /> Is anything off? --- # But what to wolves say to you? <img src="linear_regression_details_files/figure-html/wolfsims-1.png" style="display: block; margin: auto;" /> --- # Additivity and Linearity: Should account for all of the variation between residual and fitted values - what you want <img src="linear_regression_details_files/figure-html/pufferadd-1.png" style="display: block; margin: auto;" /> --- # Additivity and Linearity: Wolf Problems? <img src="linear_regression_details_files/figure-html/wolfadd-1.png" style="display: block; margin: auto;" /> -- **Solutions:** Nonlinear transformations or a better model! --- # Independence of Errors - Are all replicates TRULY independent - Did they come from the same space, time, etc. - Non-independence can introduce **BIAS** - SEs too small (at the least) - Causal inference invalid - Incoporate Non-independence into models (many methods) --- # Equal Variance of Errors: No Pattern to Residuals and Fitted Values <img src="linear_regression_details_files/figure-html/resfit_puffer-1.png" style="display: block; margin: auto;" /> --- # Equal Variance of Errors: What is up with intermediate Wolf Values <img src="linear_regression_details_files/figure-html/resfit-1.png" style="display: block; margin: auto;" /> --- # Equal Variance of Errors: Problems and Solutions - Shapes (cones, footballs, etc.) with no bias in fitted v. residual relationship - A linear relationship indicates an additivity problem - Can solve with a better model (more predictors) - Can solve with weighting by X values, if source of heteroskedasticity known - This actually means we model the variance as a function of X - `\(\epsilon_i \sim(N, f(x_i))\)` - Minor problem for coefficient estimates - Major problem for doing inference and prediction as it changes error --- # Normality of errors: Did we fit the error generating process that we observed? - We assumed `\(\epsilon_i \sim N(0,\sigma)\)` - but is that right? - Can assess with a QQ-plot - Do quantiles of the residuals match quantiles of a normal distribution? - Again, minor problem for coefficient estimates - Major problem for doing inference and prediction, as it changes error --- # Equal Variance of Errors: Puffers <img src="linear_regression_details_files/figure-html/pufferqq-1.png" style="display: block; margin: auto;" /> --- # Equal Variance of Errors: Wolves underpredict at High Levels <img src="linear_regression_details_files/figure-html/wolfqq-1.png" style="display: block; margin: auto;" /> --- # Outliers: Cook's D <img src="linear_regression_details_files/figure-html/pufferout-1.png" style="display: block; margin: auto;" /> --- # Leverage: Cook's D Scaled by Value <img src="linear_regression_details_files/figure-html/pufferout_leverage-1.png" style="display: block; margin: auto;" /> --- # Leverage: Cook's D - wolves OK <img src="linear_regression_details_files/figure-html/pufferout_cook-1.png" style="display: block; margin: auto;" /> --- # Everyone worries about outliers, but... - Are they real? - Do they indicate a problem or a nonlinearity? - Remove only as a dead last resort - If from a nonlinearity, consider transformation --- # Assumptions (in rough descending order of importance) 1. Validity: only you know! 2. Representativeness: look at nature 3. Model captures features in the data: compare model v. data! 4. Additivity and Linearity: compare model v. data! 5. Independence of Errors: consider sampling design 6. Equal Variance of Errors: evaluate res-fit 7. Normality of Errors: evaluate qq and levene test 8. Minimal Outlier Influence: evaluate Cook's D --- # Digging Deeper into Regression 1. Assumptions: Is our fit valid? 2. .red[How did we fit this model?] --- # So, uh.... How would you fit a line here? <img src="linear_regression_details_files/figure-html/puffer_only_scatter-1.png" style="display: block; margin: auto;" /> --- # Lots of Possible Lines - How would you decide? <img src="linear_regression_details_files/figure-html/lsq-1.png" style="display: block; margin: auto;" /> --- # Method of Model Fitting 1. Least Squares - Conceptually Simple - Minimizes distance between fit and residuals - Approximations of quantities based on frequentist logic 2. Likelihood - Flexible to many models - Produces likelihood surface of different parameters - Equivalent to LS for Gaussian likelihood - Approximations of quantities based on frequentist logic 3. Bayesian - Incorporates prior knowledge - Probability for any parameter is likelihood * prior - Superior for quantifying uncertainty - With "flat" priors, equivalent to least squares/likelihood - Analytic or simulated calculation of quantities --- # Basic Principles of Least Squares Regression `\(Y_i = \beta_0 + \beta_1 X_i + \epsilon_i\)` where `\(\beta_0\)` = intercept, `\(\beta_1\)` = slope. `\(\epsilon_i \sim \mathcal{N}(0, \sigma)\)` - the residuals <img src="linear_regression_details_files/figure-html/linefit-1.png" style="display: block; margin: auto;" /> --- # Basic Principles of Least Squares Regression: Total Sums of Squares `$$SST = \sum (Y_i - \bar{Y})^2$$` <img src="linear_regression_details_files/figure-html/sst-1.png" style="display: block; margin: auto;" /> --- # Basic Principles of Least Squares Regression: Total Sums of Squares `$$SST = \sum (Y_i - \bar{Y})^2$$` <img src="linear_regression_details_files/figure-html/sst2-1.png" style="display: block; margin: auto;" /> --- class: center, middle, large # Sums of Squares of a Model SST = SS Model + SS Residuals -- We want to minimize SS Residuals --- # Basic Principles of Least Squares Regression: Sums of Squares of the Model `$$SSM = \sum (\widehat{Y_i} - \bar{Y})^2$$` <img src="linear_regression_details_files/figure-html/ssm-1.png" style="display: block; margin: auto;" /> --- # Basic Principles of Least Squares Regression: Sums of Squares of the Residuals Minimize Residuals defined as `\(SS_{residuals} = \sum(Y_{i} - \widehat{Y})^2\)` <img src="linear_regression_details_files/figure-html/ssr-1.png" style="display: block; margin: auto;" /> --- class: center, middle # Is there Another Way? --- # Analytic Solution: Solving for Slope <br><br> `\(\LARGE b=\frac{s_{xy}}{s_{x}^2}\)` `\(= \frac{cov(x,y)}{var(x)}\)` -- `\(\LARGE = r_{xy}\frac{s_{y}}{s_{x}}\)` --- # Analytic Solution: Solving for Intercept <br><br> Least squares regression line always goes through the mean of X and Y `\(\Large \bar{Y} = \beta_0 + \beta_1 \bar{X}\)` <br><br> -- `\(\Large \beta_0 = \bar{Y} - \beta_1 \bar{X}\)` --- # Least Squares Visualized for Puffers <img src="linear_regression_details_files/figure-html/unnamed-chunk-1-1.png" style="display: block; margin: auto;" /> --- # Likelihood - Flexible to many models - Produces likelihood surface of different parameters - Equivalent to LS for Gaussian likelihood - Approximations of quantities based on frequentist logic -- `\(L = \prod p(Data|parmeters)\)` -- `\(L(\theta | D) = \prod dnorm(y_i, \mu = \beta_0 + \beta_1 x_i, \sigma)\)` -- Deviance = -2 * Log Likelihood -- This gives us the same answer as Least Squares --- # Likelihood: Minimizing Deviance (Maximizing Likelihood) by Search ``` Preliminary iteration .. Done Profiling for parameter (Intercept) ... Done Profiling for parameter resemblance ... Done ``` <img src="linear_regression_details_files/figure-html/unnamed-chunk-2-1.png" style="display: block; margin: auto;" /> --- # Bayesian - Incorporates prior knowledge - Probability for any parameter is likelihood * prior - Superior for quantifying uncertainty - With "flat" priors, equivalent to least squares/likelihood - Analytic or simulated calculation of quantities `$$p(H|D) = \frac{p(D|H)p(H)}{p(D)}$$` --- # Bayes: Creating a Posterior Probability Distribution <img src="linear_regression_details_files/figure-html/unnamed-chunk-3-1.png" style="display: block; margin: auto;" /> -- Searches `\(p(H|D) = \frac{p(D|H)p(H)}{p(D)}\)` --- # Bayes: Creating a Posterior Probability Distribution <img src="linear_regression_details_files/figure-html/unnamed-chunk-4-1.png" style="display: block; margin: auto;" /> --- # Linear Regression - the Core of Everything - Make sure you meet assumptions - Don't burn down Prague - Many ways to fit - We will talk inference later - The key is looking at estimated values and their implications - Look at precision - do you feel comfortable with inference?