Iteration
A Repetitive Workflow
- Often, we want to perform the same task on different data sets
- Until now, we’ve done this with
group_byandsummarize
- But what if we need to do more than a simple summary?
The Gapminder Data
Questions we can ask
- How does the relationship change by year?
- How does the relationship differ by country?
- What is the ditribution of slopes by year, country, or both!
But here is where we start…
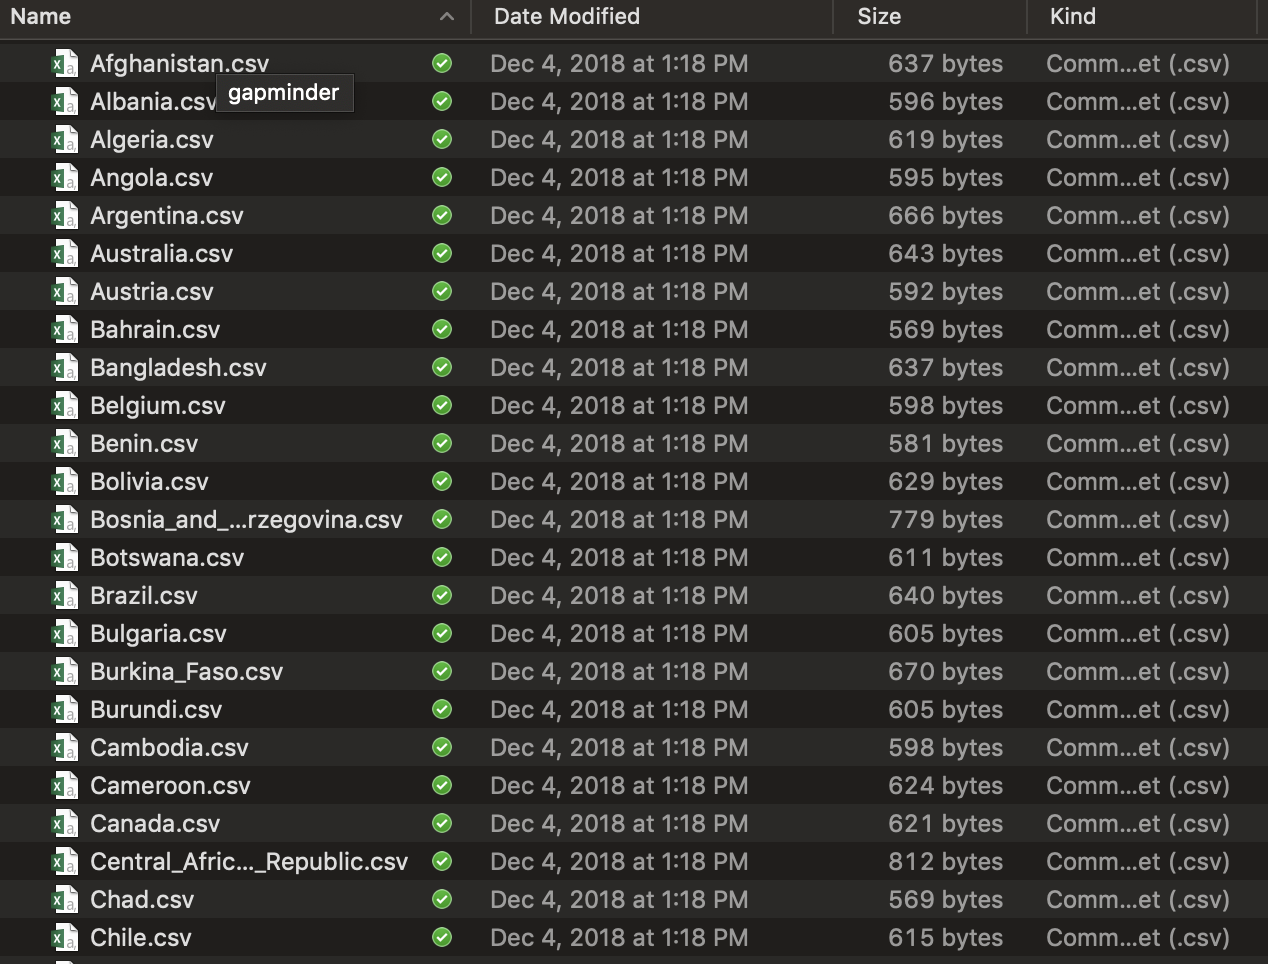
So many files…
What do we know how to do?
- Write a workflow for one file!
read_csv()
lm()
broom:tidy()
- But we want to iterate over all files and lots of models…
Isn’t this what computers/robots are all about?

The Map Paradigm
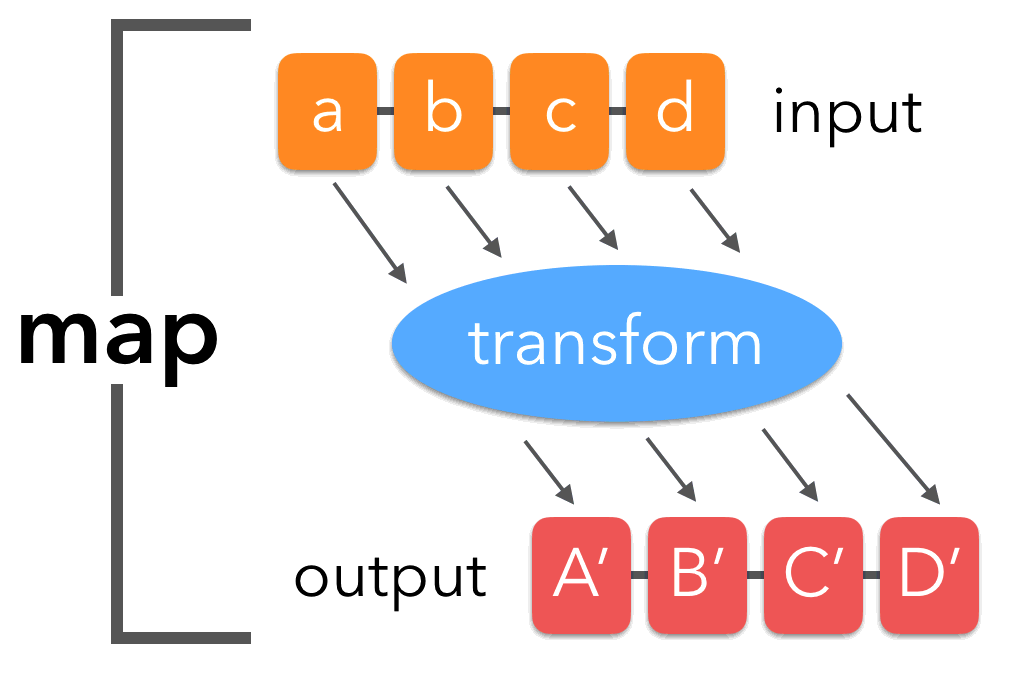

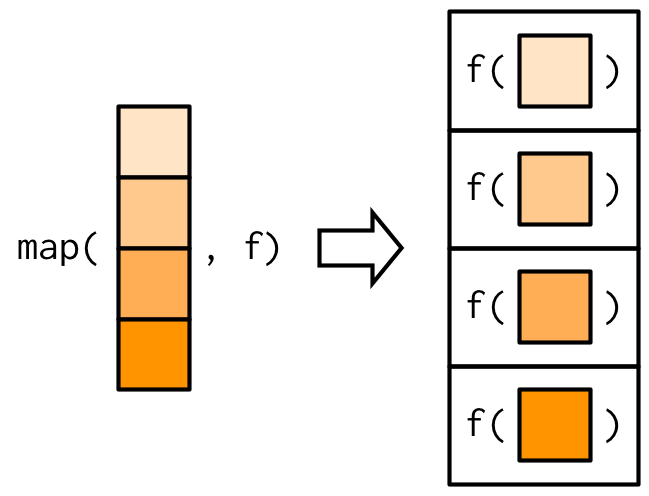
Map functions
Take a list or vector as input
- Apply a function to each elment of the list/vector
- (note, see the R apply, sapply, and lapply functions, too)
Return the corresponding object, bound together into a prespecified type
Map in visual terms
Median Example
Median Example
$a
[1] 0.5656634

$b
[1] 0.1513132

$c
[1] 0.085427

$d
[1] 0.4215443
The Map Paradigm
What if I don’t want a list

The world of maps
map()makes a list.map_df()makes a tibble/data frame.map_lgl()makes a logical vector.map_int()makes an integer vector.map_dbl()makes a double vector.map_chr()makes a character vector.
More medians
        a         b         c         d
0.5656634 0.1513132 0.0854270 0.4215443 a b c d
"0.565663" "0.151313" "0.085427" "0.421544" # A tibble: 1 x 4
a b c d
<dbl> <dbl> <dbl> <dbl>
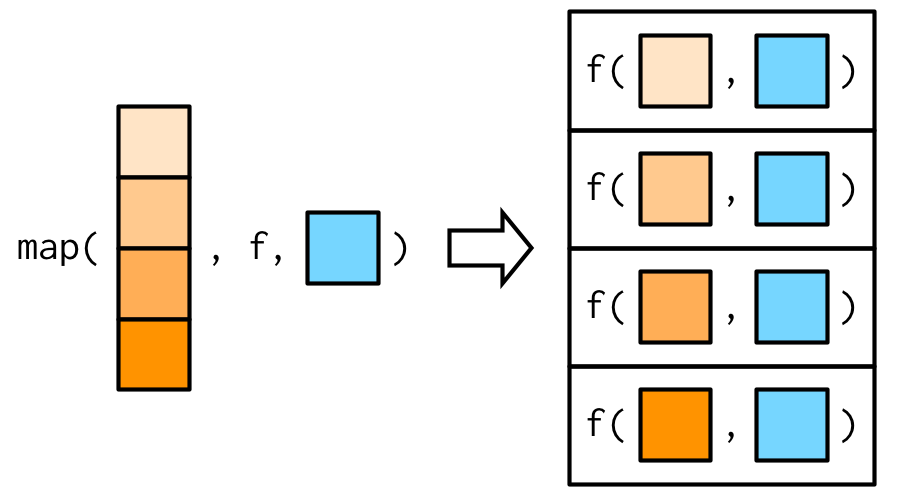
1 0.566 0.151 0.0854 0.422What if I have more than one argument?
        a         b         c         d
0.5656634 0.1513132 0.0854270 0.4215443
What if I have more than one argument?
What if I want a more flexible syntax?
        a         b         c         d
0.5656634 0.1513132 0.0854270 0.4215443
You try!
What does
map(-2:2, rnorm, n = 5)do? How is it different frommap_dbl(-2:2, rnorm, n = 5)?Get the mean of each column of
dfCompute the number of unique values in each column of
iris(hint, you’ll need length and unique)!
Now, what about our problem?
We have a lot of files
They are all in the same format, so…
Your turn again!
Make one big tibble using
list.files(),map_df(), andread_csv()Make a list of tibbles
list.files(),map(), andread_csv()as wellYou might need to use
paste0()orstringr::str_cto make a full file path with the output oflist.files()
One Line to load them all
files <- list.files("./data/gapminder/") %>%
  str_c("./data/gapminder/", .)

gapminder_df <- map_df(files, read_csv)

gapminder_df
# A tibble: 1,704 x 6
country continent year lifeExp pop gdpPercap
<chr> <chr> <int> <dbl> <int> <dbl>
1 Afghanistan Asia 1952 28.8 8425333 779.
2 Afghanistan Asia 1957 30.3 9240934 821.
3 Afghanistan Asia 1962 32.0 10267083 853.
4 Afghanistan Asia 1967 34.0 11537966 836.
5 Afghanistan Asia 1972 36.1 13079460 740.
6 Afghanistan Asia 1977 38.4 14880372 786.
7 Afghanistan Asia 1982 39.9 12881816 978.
8 Afghanistan Asia 1987 40.8 13867957 852.
9 Afghanistan Asia 1992 41.7 16317921 649.
10 Afghanistan Asia 1997 41.8 22227415 635.
# ... with 1,694 more rowsOr - keep ’em in a list
The nice thing about a list is that we can just use map() on it in the future!

Is there More?
Oh, so much more - see
https://adv-r.hadley.nz/functionals.html
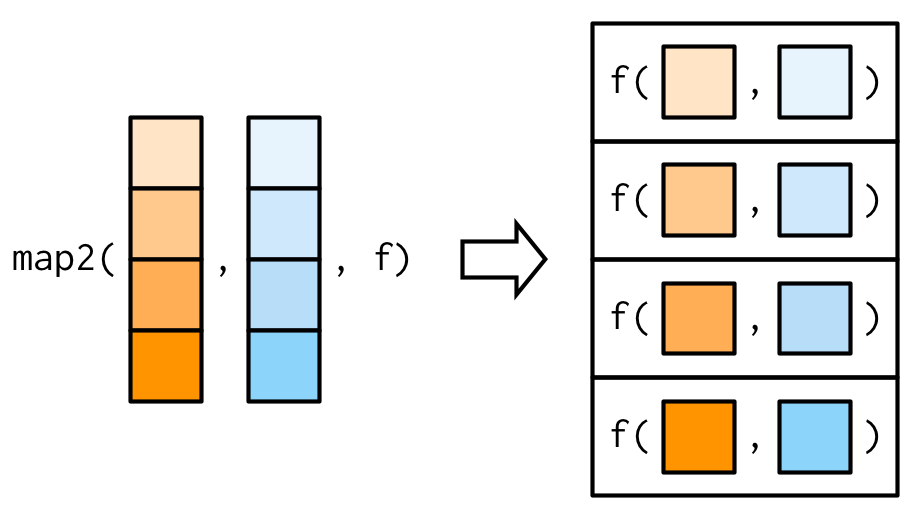
Map with Two Lists
 Or use
 ~ with .x and .y
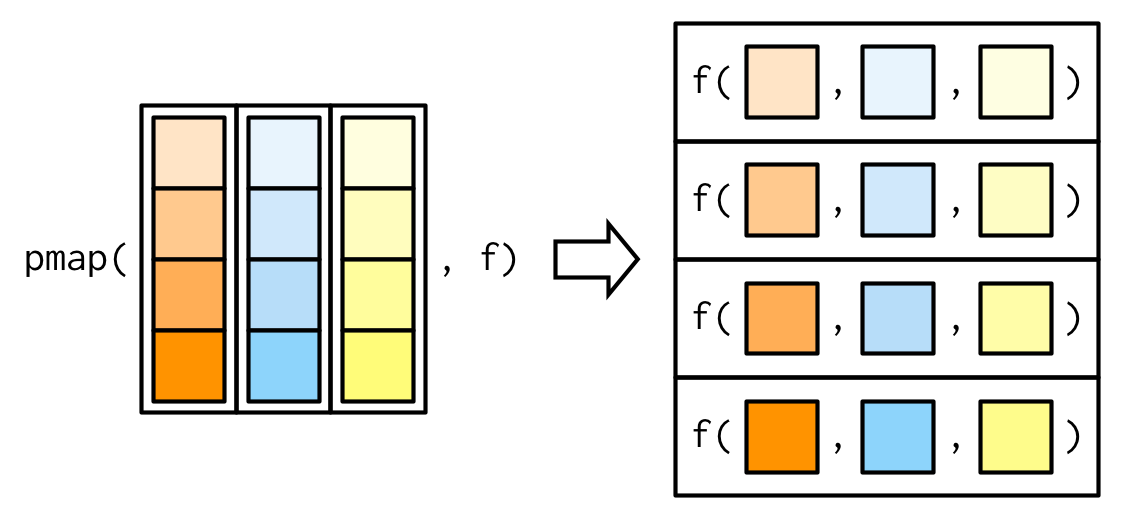
Map with an arbitrary number of lists
Invisible Outputs (e.g. for plotting)

Use list values AND indices
(SUPER useful for time series, etc.)
 [1]  1.479186  2.015898  3.012937  4.204430  5.676565  6.903000  7.310521
 [8]  8.670990  9.039871 10.572125
And more…
r <- 1.5
k <- 100
pop <- accumulate(1:30, ~r*.x*(1-.x/k), init = 2)
plot(pop, type = "l", ylab = "N", xlab = "time")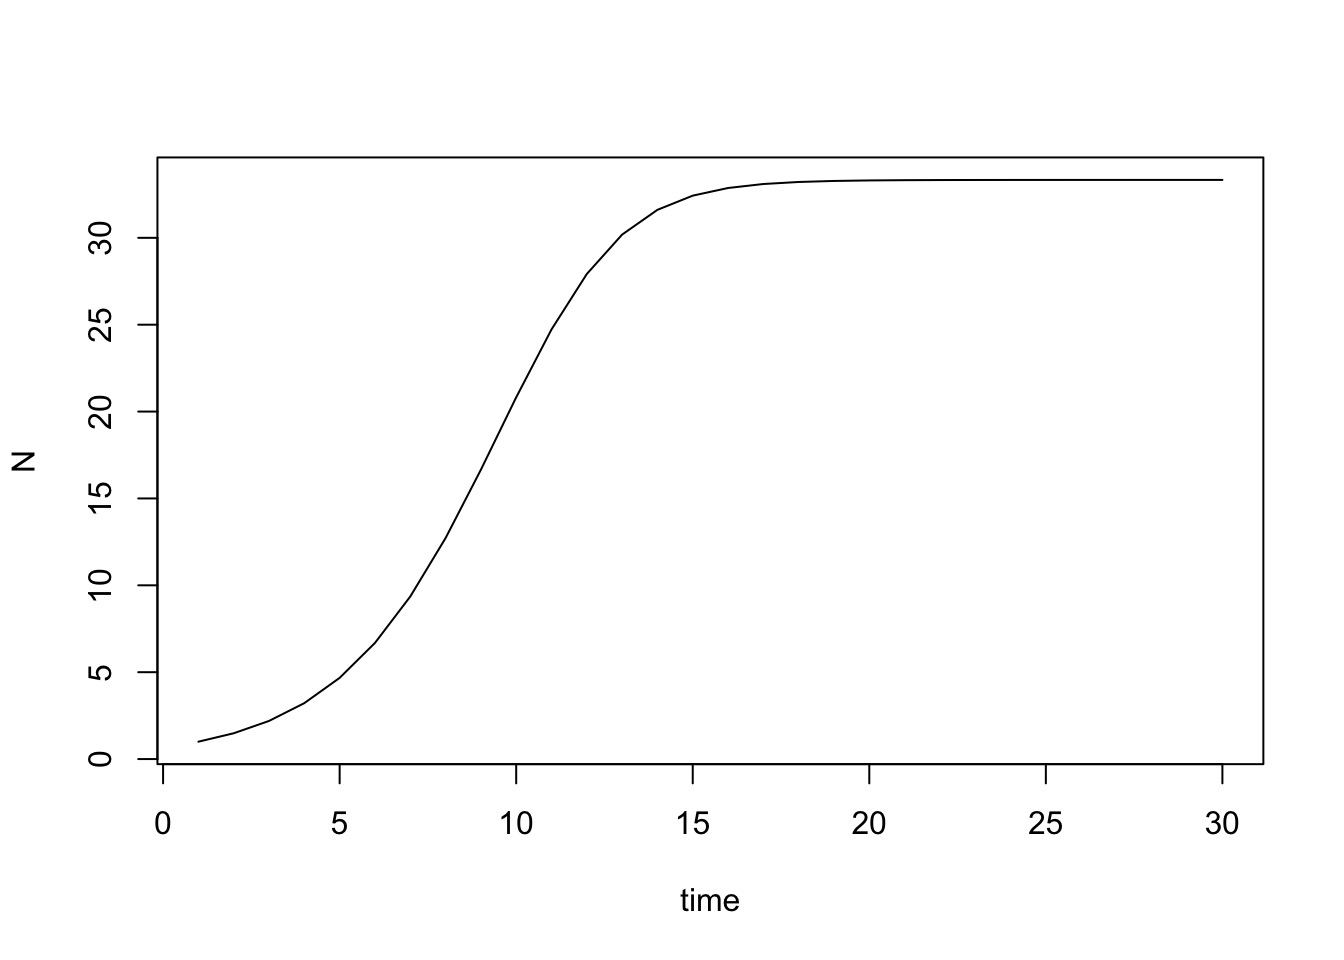
Back to our problem
- We have loaded everything
- But - how do we get a distribution of lifeExp ~ pop by country?
mapto the rescue!
The Simple List-based solution for model fits
Just fit for each tibble!
Shockingly simple, no?
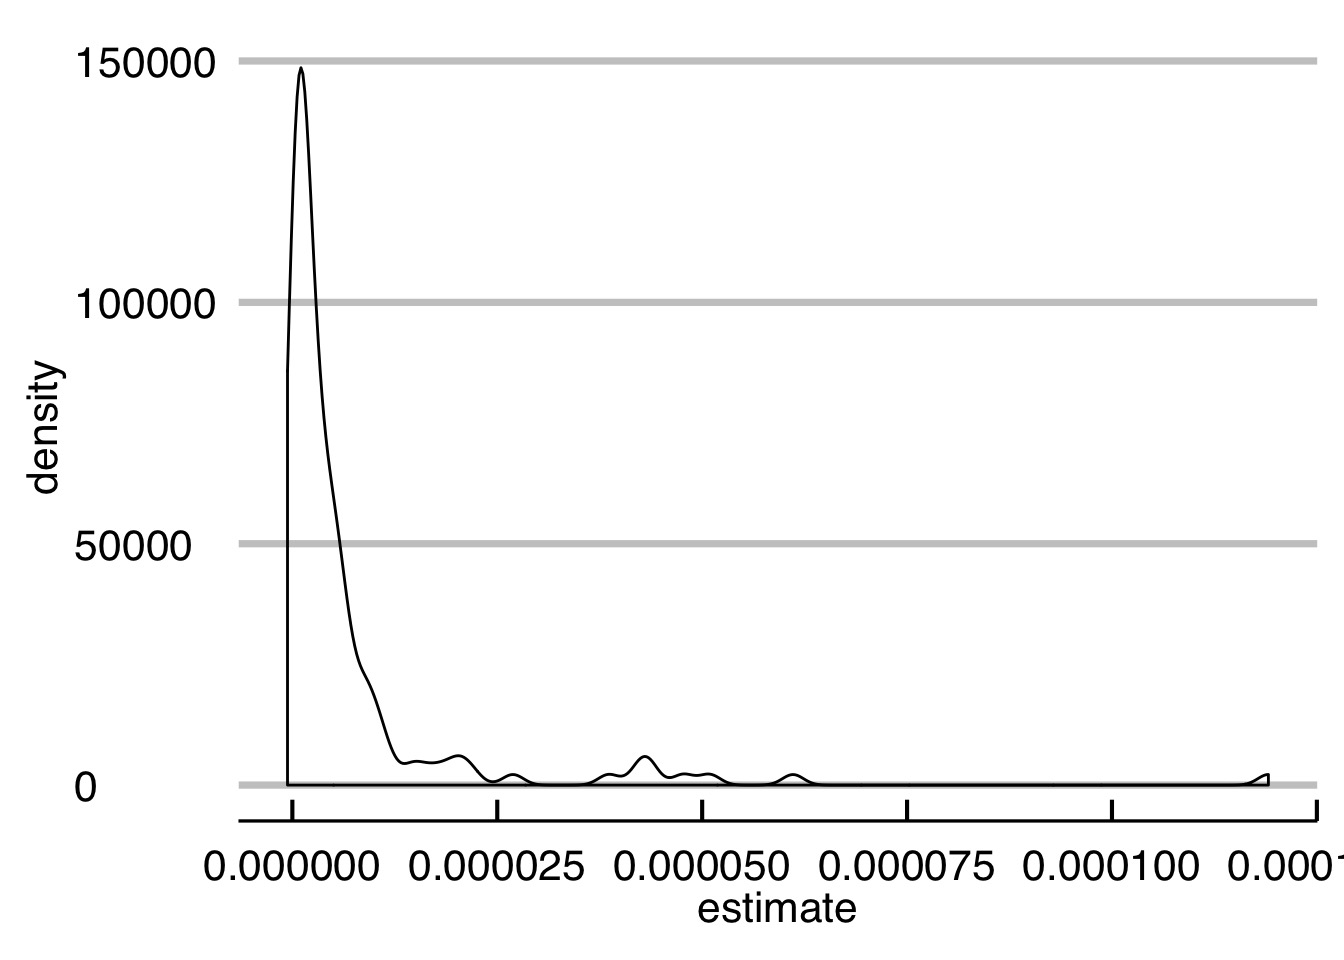
And those coefficients? Map again to the rescue!
# A tibble: 142 x 6
   Country term     estimate     std.error statistic  p.value
   <chr>   <chr>       <dbl>         <dbl>     <dbl>    <dbl>
 1 1       pop   0.000000577 0.000000134        4.30 1.57e- 3
 2 2       pop   0.00000729  0.000000717       10.2  1.37e- 6
 3 3       pop   0.00000118  0.0000000759      15.5  2.55e- 8
 4 4       pop   0.00000128  0.000000248        5.14 4.35e- 4
 5 5       pop   0.000000553 0.0000000128      43.1  1.08e-12
 6 6       pop   0.00000105  0.0000000505      20.8  1.49e- 9
 7 7       pop   0.00000974  0.000000729       13.3  1.07e- 7
 8 8       pop   0.0000386   0.00000402         9.60 2.31e- 6
 9 9       pop   0.000000259 0.00000000658     39.4  2.66e-12
10 10      pop   0.00000692  0.000000696        9.95 1.67e- 6
# ... with 132 more rows
And the distribution…
Your turn!
Start with:
- Plot the relationship between slope and year for
lifeExp ~ pop
Solution
But I don’t like lists! Enter - the list-column!
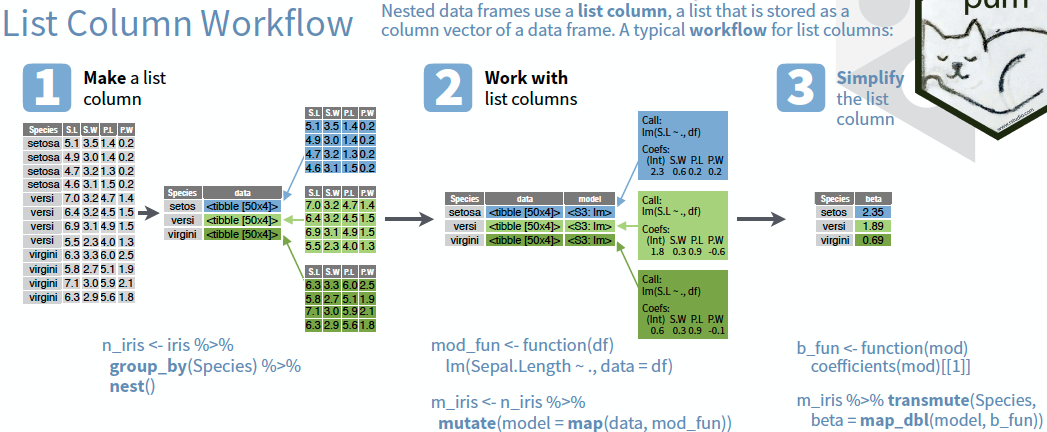
Let’s nest a listcolumn!
# A tibble: 142 x 2
   country     data
   <chr>       <list>
 1 Afghanistan <tibble [12 × 5]>
 2 Albania     <tibble [12 × 5]>
 3 Algeria     <tibble [12 × 5]>
 4 Angola      <tibble [12 × 5]>
 5 Argentina   <tibble [12 × 5]>
 6 Australia   <tibble [12 × 5]>
 7 Austria     <tibble [12 × 5]>
 8 Bahrain     <tibble [12 × 5]>
 9 Bangladesh  <tibble [12 × 5]>
10 Belgium     <tibble [12 × 5]>
# ... with 132 more rows
Map + Listcolumns = Love
What did we do?
# A tibble: 142 x 3
   country     data              mods
   <chr>       <list>            <list>
 1 Afghanistan <tibble [12 × 5]> <S3: lm>
 2 Albania     <tibble [12 × 5]> <S3: lm>
 3 Algeria     <tibble [12 × 5]> <S3: lm>
 4 Angola      <tibble [12 × 5]> <S3: lm>
 5 Argentina   <tibble [12 × 5]> <S3: lm>
 6 Australia   <tibble [12 × 5]> <S3: lm>
 7 Austria     <tibble [12 × 5]> <S3: lm>
 8 Bahrain     <tibble [12 × 5]> <S3: lm>
 9 Bangladesh  <tibble [12 × 5]> <S3: lm>
10 Belgium     <tibble [12 × 5]> <S3: lm>
# ... with 132 more rows
What about coefficients?
And…getting it back?
And…getting it back?
# A tibble: 142 x 6
   country     term     estimate     std.error statistic  p.value
   <chr>       <chr>       <dbl>         <dbl>     <dbl>    <dbl>
 1 Afghanistan pop   0.000000577 0.000000134        4.30 1.57e- 3
 2 Albania     pop   0.00000729  0.000000717       10.2  1.37e- 6
 3 Algeria     pop   0.00000118  0.0000000759      15.5  2.55e- 8
 4 Angola      pop   0.00000128  0.000000248        5.14 4.35e- 4
 5 Argentina   pop   0.000000553 0.0000000128      43.1  1.08e-12
 6 Australia   pop   0.00000105  0.0000000505      20.8  1.49e- 9
 7 Austria     pop   0.00000974  0.000000729       13.3  1.07e- 7
 8 Bahrain     pop   0.0000386   0.00000402         9.60 2.31e- 6
 9 Bangladesh  pop   0.000000259 0.00000000658     39.4  2.66e-12
10 Belgium     pop   0.00000692  0.000000696        9.95 1.67e- 6
# ... with 132 more rows
You try!
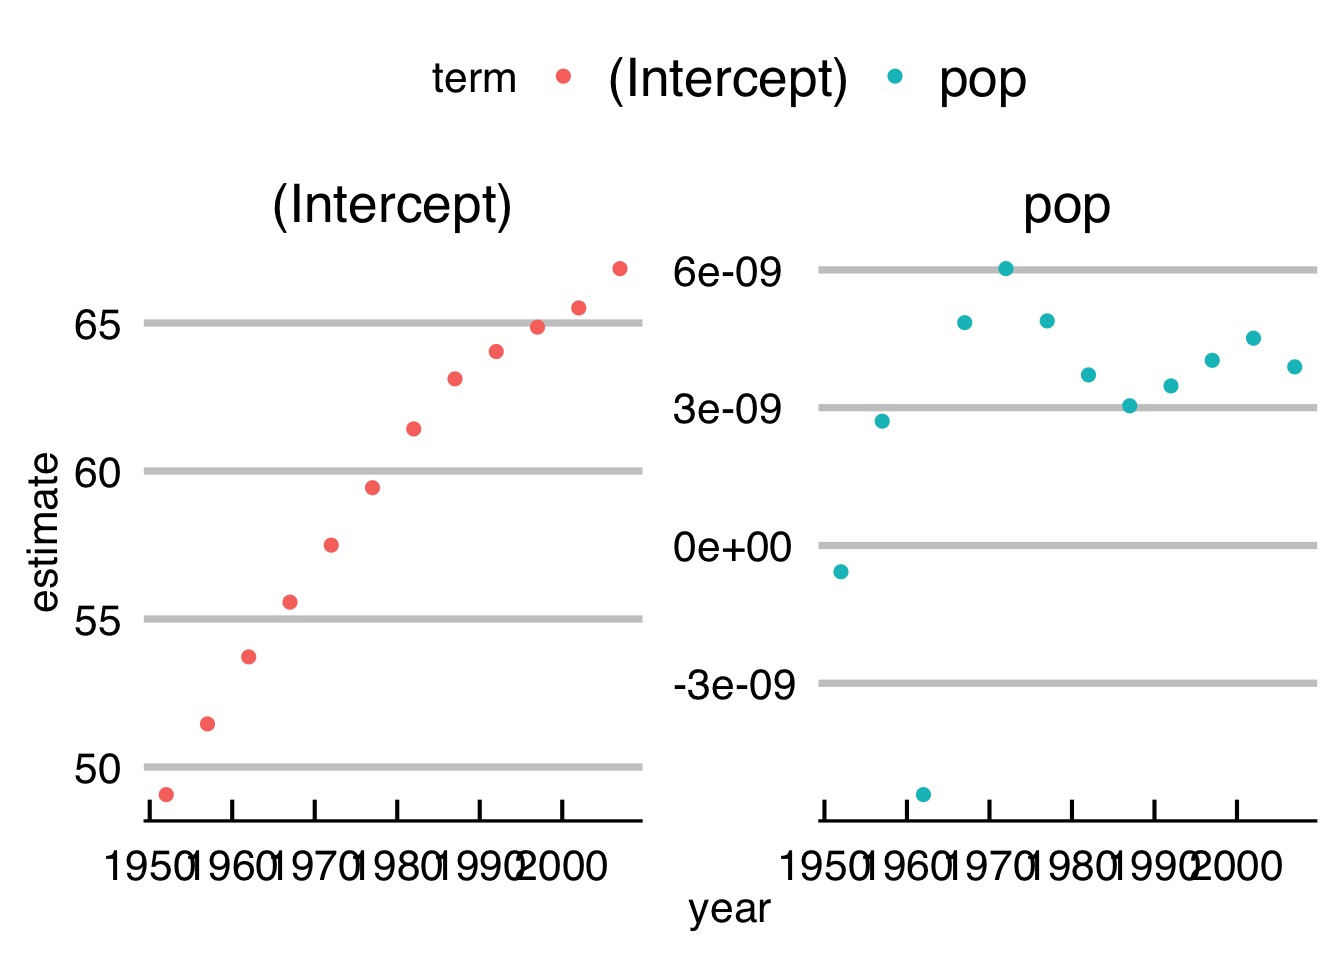
- Fit the relationship by year
- Plot coefficients (slope and intercept) by year (facet the term!)
Solution
Solution (cont’d)