class: center, middle # Cross-Validation and AIC<br> <!-- next year, more on overfitting and generality versus specificity -->  --- # HOT ROACHES! <br><br> .pull-left[ - Do American Cockroaches sense surrounding temperatures and respond? - Survey of activity by the prothoracic ganglion in different temperature regimes - Murphy and Heath 1983 J. Exp. Biol ] .pull-right[ 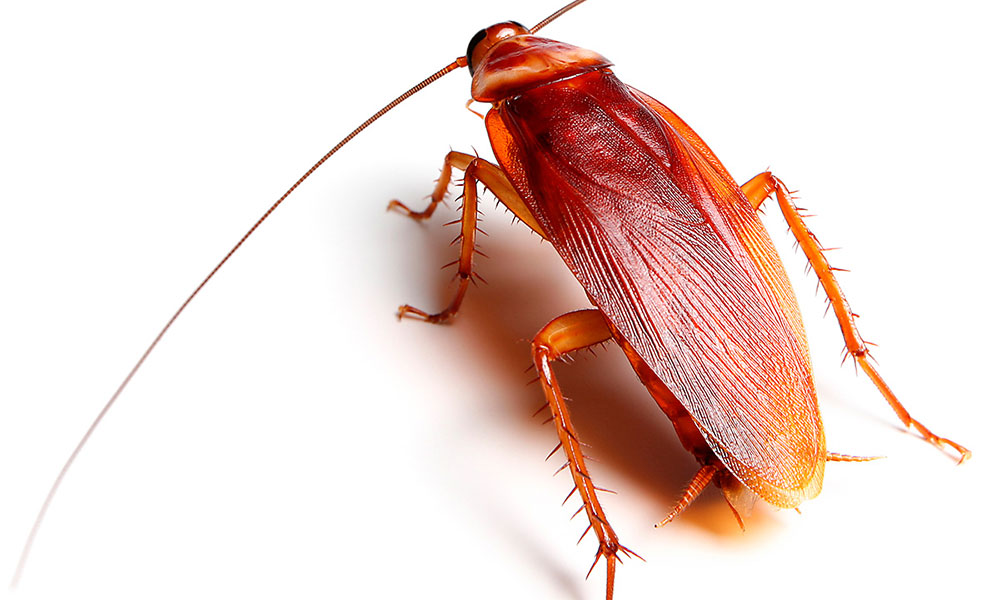 ] --- # Which is best? <img src="crossvalidation_files/figure-html/roachplot_int-1.png" style="display: block; margin: auto;" /> --- # Which is best? <img src="crossvalidation_files/figure-html/roach_poly_plot-1.png" style="display: block; margin: auto;" /> --- # Applying Different Styles of Inference - **Null Hypothesis Testing**: What's the probability that things are not influencing our data? - Deductive - **Cross-Validation**: How good are you at predicting new data? - Deductive - **Model Comparison**: Comparison of alternate hypotheses - Deductive or Inductive - **Probabilistic Inference**: What's our degree of belief in a data? - Inductive --- # Applying Different Styles of Inference .grey[ - **Null Hypothesis Testing**: What's the probability that things are not influencing our data? - Deductive ] - **Cross-Validation**: How good are you at predicting new data? - Deductive - **Model Comparison**: Comparison of alternate hypotheses - Deductive or Inductive .grey[ - **Probabilistic Inference**: What's our degree of belief in a data? - Inductive ] --- # Validating Across Models 1. Out of Sample Prediction 2. Train-Test Random Cross Validation 3. K-Fold Cross Validation 4. LOOCV 5. AIC and Model Comparison --- # What is Out of Sample Prediction 1. We fit a model 2. We have a new sample(s) with a full set of predictors 3. We apply the model to our new prediction 4. We see how badly we deviate from our fit model --- # Common Out of Sample Metrics `\(MSE = \frac{1}{n}\sum{(Y_i - \hat{Y})^2}\)` - In units of sums of squares `\(RMSE = \sqrt{\frac{1}{n}\sum{(Y_i - \hat{Y})^2}}\)` - In units of response variable! - Estimate of SD of out of sample predictions `\(Deviance = -2 \sum log(\space p(Y_i | \hat{Y}, \theta)\space)\)` - Probability-based - Encompasses a wide number of probability distributions - Just MSE for gaussian linear models! --- # Evaluating and Out of Sample Point: What if we had left out the 1st row of Roach data? <img src="crossvalidation_files/figure-html/one_loo_roach-1.png" style="display: block; margin: auto;" /> --- # We Can See This Model is Worse at Prediction <img src="crossvalidation_files/figure-html/one_loo_roach_int-1.png" style="display: block; margin: auto;" /> --- # Evaluating Predictive Ability of Statistical Models: Cross-Validation 1. Fit a model on a **training** data set 2. Evaluate a Model on a **TEST** data set 3. Compare predictive ability of competing models with MSE, Deviance, etc. --- # But.... what data do I use for training and testing? ## Random Cross-Validation - Cross-validating on only one point could be biased by choice of poing - So, choose a random subset of your data! - Typically use a 60:40 split, or 70:30 for lower sample size - Calculate fit metrics for alternate models --- # A Random Cross-Validation Sample <img src="crossvalidation_files/figure-html/unnamed-chunk-1-1.png" style="display: block; margin: auto;" /> --- # The Fits <img src="crossvalidation_files/figure-html/unnamed-chunk-2-1.png" style="display: block; margin: auto;" /> --- # Cross-Validation: the Fits <img src="crossvalidation_files/figure-html/unnamed-chunk-3-1.png" style="display: block; margin: auto;" /> --- # Results of Random CV RMSE Temperature Model: ``` [1] 23.41283 ``` RMSE Intercept Only Model: ``` [1] 29.90318 ``` This is the estimate of the SD of the training set - which is acceptable for your predictions? --- # Validating Across Models 1. Out of Sample Prediction 2. Train-Test Random Cross Validation 3. .red[K-Fold Cross Validation] 4. LOOCV 5. AIC and Model Comparison --- class: center, middle # But, wait, what if I choose a bad section of the data by chance? --- # K-Fold Cross Validation - Data is split into K sets of training and testing folds - Performance is averaged over all sets .center[ 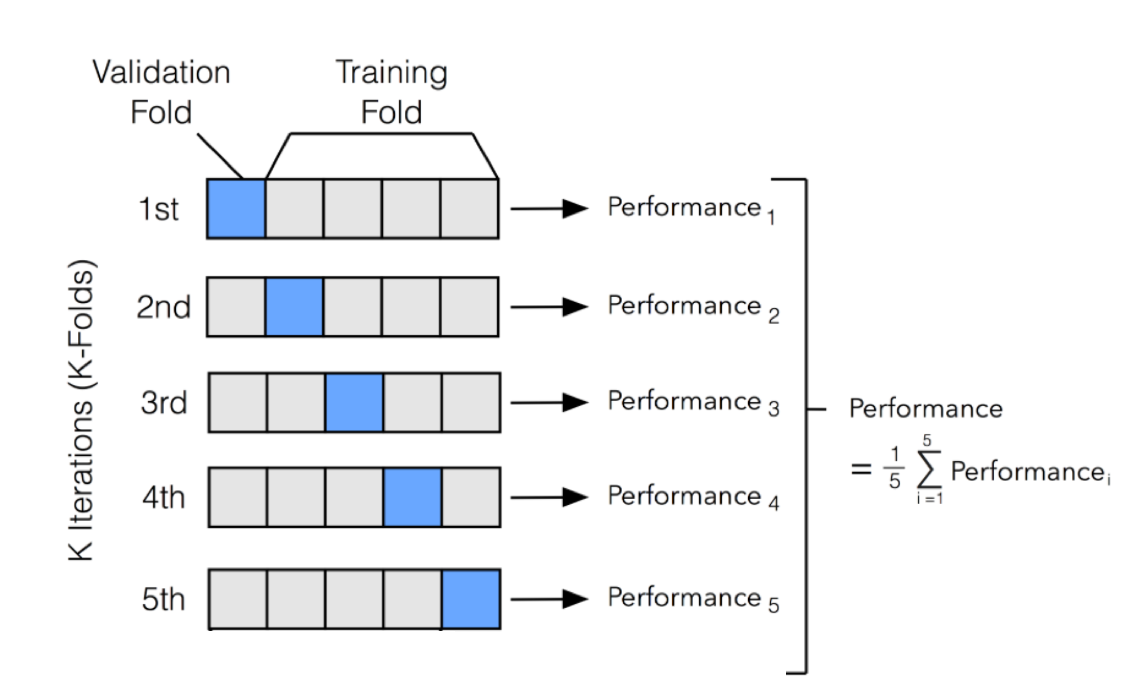 ] --- # Our Models <img src="crossvalidation_files/figure-html/roachplot_int-1.png" style="display: block; margin: auto;" /> --- # Five-Fold CV |id | mse| rmse| |:-----|--------:|--------:| |Fold1 | 563.9648| 23.74794| |Fold2 | 577.3978| 24.02910| |Fold3 | 530.5703| 23.03411| |Fold4 | 491.1538| 22.16199| |Fold5 | 491.2940| 22.16515| Temperature Model Score: 530.8761442 Intercept Only Score: 788.2974 <!-- eh, I was lazy, and just reran the above with a different model --> --- # But what if there is some feature in your data that splits it into groups? ## Stratified K-Fold CV! .center[.middle[ 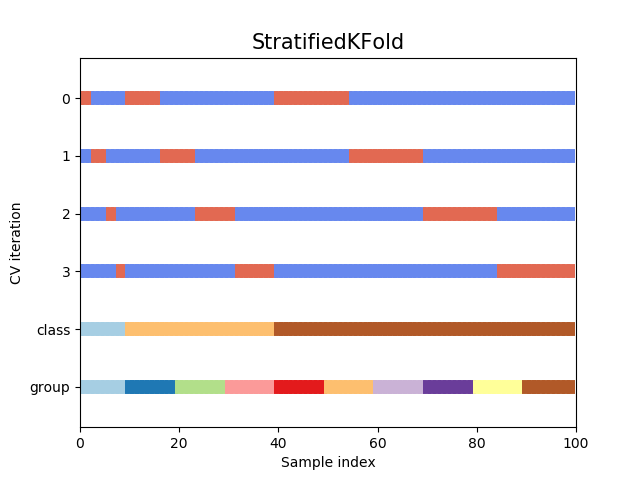 ]] --- # Validating Across Models 1. Out of Sample Prediction 2. Train-Test Random Cross Validation 3. K-Fold Cross Validation 4. .red[LOOCV] 5. AIC and Model Comparison --- # Problem: How Many Folds? - What is a good number? - More folds = smaller test dataset - Bias-Variance tradeoff if also looking at coefficients -- - 5 and 10 are fairly standard, depending on data set size -- - More folds = closer to average out of sample error -- - But, more folds can be computationally intensive -- - Still, Leave One Out Cross Validation is very powerful --- # LOOCV (Leave One Out Cross-Validation) .center[.middle[  ]] --- # LOOCV (Leave One Out Cross-Validation) .center[.middle[ 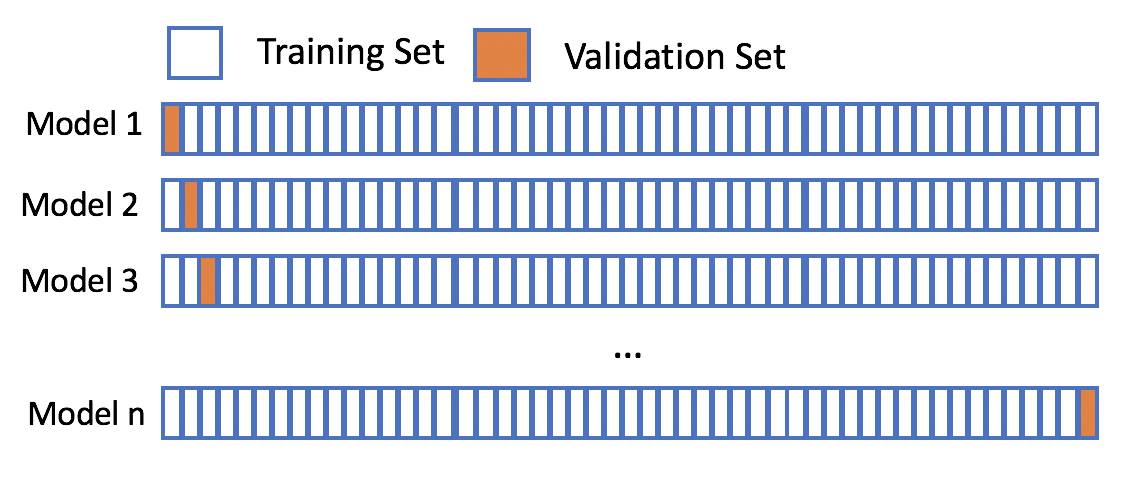 ]] --- # LOOCV Comparison of Out of Sample Deviance (MSE) Rate Model:569.58 Intercept Only Model: 818.68 <img src="crossvalidation_files/figure-html/roachplot_int-1.png" style="display: block; margin: auto;" /> --- #What abour our polynomial models? <img src="crossvalidation_files/figure-html/roach_poly_plot-1.png" style="display: block; margin: auto;" /> --- # Using LOOCV to Compare Polynomial Fits <img src="crossvalidation_files/figure-html/loocv_poly-1.png" style="display: block; margin: auto;" /> --- # Validating Across Models 1. Out of Sample Prediction 2. Train-Test Random Cross Validation 3. K-Fold Cross Validation 4. LOOCV 5. .red[AIC and Model Comparison] --- class: center, middle # This is all well and very computationally intensive, but, what about when we have n = 1e5, or many different models? --- # Can our Training Deviance Provide an Approximation of our Test Deviance? <img src="crossvalidation_files/figure-html/traintest_plot-1.png" style="display: block; margin: auto;" /> --- # Does the Gap Increase with Number of Parameters? <img src="crossvalidation_files/figure-html/k_plot-1.png" style="display: block; margin: auto;" /> .large[.center[Slope = 1.89 ≈ 2]] --- # Enter the AIC .pull-left[  ] .pull-right[ - `\(E[D_{test}] = D_{train} + 2K\)` - This is Akaike's Information Criteria (AIC) ] `$$\Large AIC = Deviance + 2K$$` --- # AIC and Prediction - AIC optimized for forecasting (out of sample deviance) - Approximates average out of sample deviance from test data - Assumes large N relative to K - AICc for a correction --- # But Sample Size Can Influence Fit... <br><br> `$$\large AIC = -2log(L(\theta | x)) + 2K$$` <br><br><br> `$$\large AICc = AIC + \frac{2K(K+1)}{n-K-1}K$$` --- # How can we Use AIC Values? `$$\Delta AIC = AIC_{i} - min(AIC)$$` Rules of Thumb from Burnham and Anderson(2002): -- - `\(\Delta\)` AIC `\(<\)` 2 implies that two models are similar in their fit to the data -- - `\(\Delta\)` AIC between 3 and 7 indicate moderate, but less, support for retaining a model -- - `\(\Delta\)` AIC `\(>\)` 10 indicates that the model is very unlikely --- # A Quantitative Measure of Relative Support `$$w_{i} = \frac{e^{-\Delta_{i}/2 }}{\displaystyle \sum^R_{r=1} e^{-\Delta_{i}/2 }}$$` Where `\(w_{i}\)` is the *relative support* for model i compared to other models in the set being considered. Model weights summed together = 1 --- # Let's Apply AIC to our Polynomials <img src="crossvalidation_files/figure-html/roach_poly_plot-1.png" style="display: block; margin: auto;" /> --- # Model Information for Polynomial Fits <table> <thead> <tr> <th style="text-align:left;"> </th> <th style="text-align:left;"> Modnames </th> <th style="text-align:right;"> K </th> <th style="text-align:right;"> AIC </th> <th style="text-align:right;"> Delta_AIC </th> <th style="text-align:right;"> ModelLik </th> <th style="text-align:right;"> AICWt </th> <th style="text-align:right;"> LL </th> <th style="text-align:right;"> Cum.Wt </th> </tr> </thead> <tbody> <tr> <td style="text-align:left;"> 3 </td> <td style="text-align:left;"> Order 3 </td> <td style="text-align:right;"> 5 </td> <td style="text-align:right;"> 522.36 </td> <td style="text-align:right;"> 0.00 </td> <td style="text-align:right;"> 1.00 </td> <td style="text-align:right;"> 0.44 </td> <td style="text-align:right;"> -256.18 </td> <td style="text-align:right;"> 0.44 </td> </tr> <tr> <td style="text-align:left;"> 4 </td> <td style="text-align:left;"> Order 4 </td> <td style="text-align:right;"> 6 </td> <td style="text-align:right;"> 523.38 </td> <td style="text-align:right;"> 1.02 </td> <td style="text-align:right;"> 0.60 </td> <td style="text-align:right;"> 0.26 </td> <td style="text-align:right;"> -255.69 </td> <td style="text-align:right;"> 0.70 </td> </tr> <tr> <td style="text-align:left;"> 5 </td> <td style="text-align:left;"> Order 5 </td> <td style="text-align:right;"> 7 </td> <td style="text-align:right;"> 525.34 </td> <td style="text-align:right;"> 2.98 </td> <td style="text-align:right;"> 0.23 </td> <td style="text-align:right;"> 0.10 </td> <td style="text-align:right;"> -255.67 </td> <td style="text-align:right;"> 0.79 </td> </tr> <tr> <td style="text-align:left;"> 1 </td> <td style="text-align:left;"> Order 1 </td> <td style="text-align:right;"> 3 </td> <td style="text-align:right;"> 525.92 </td> <td style="text-align:right;"> 3.55 </td> <td style="text-align:right;"> 0.17 </td> <td style="text-align:right;"> 0.07 </td> <td style="text-align:right;"> -259.96 </td> <td style="text-align:right;"> 0.87 </td> </tr> <tr> <td style="text-align:left;"> 6 </td> <td style="text-align:left;"> Order 6 </td> <td style="text-align:right;"> 8 </td> <td style="text-align:right;"> 526.67 </td> <td style="text-align:right;"> 4.31 </td> <td style="text-align:right;"> 0.12 </td> <td style="text-align:right;"> 0.05 </td> <td style="text-align:right;"> -255.33 </td> <td style="text-align:right;"> 0.92 </td> </tr> <tr> <td style="text-align:left;"> 2 </td> <td style="text-align:left;"> Order 2 </td> <td style="text-align:right;"> 4 </td> <td style="text-align:right;"> 526.89 </td> <td style="text-align:right;"> 4.53 </td> <td style="text-align:right;"> 0.10 </td> <td style="text-align:right;"> 0.05 </td> <td style="text-align:right;"> -259.44 </td> <td style="text-align:right;"> 0.96 </td> </tr> <tr> <td style="text-align:left;"> 7 </td> <td style="text-align:left;"> Order 7 </td> <td style="text-align:right;"> 9 </td> <td style="text-align:right;"> 528.27 </td> <td style="text-align:right;"> 5.91 </td> <td style="text-align:right;"> 0.05 </td> <td style="text-align:right;"> 0.02 </td> <td style="text-align:right;"> -255.14 </td> <td style="text-align:right;"> 0.99 </td> </tr> <tr> <td style="text-align:left;"> 8 </td> <td style="text-align:left;"> Order 8 </td> <td style="text-align:right;"> 10 </td> <td style="text-align:right;"> 530.27 </td> <td style="text-align:right;"> 7.91 </td> <td style="text-align:right;"> 0.02 </td> <td style="text-align:right;"> 0.01 </td> <td style="text-align:right;"> -255.14 </td> <td style="text-align:right;"> 1.00 </td> </tr> <tr> <td style="text-align:left;"> 9 </td> <td style="text-align:left;"> Order 9 </td> <td style="text-align:right;"> 11 </td> <td style="text-align:right;"> 532.24 </td> <td style="text-align:right;"> 9.87 </td> <td style="text-align:right;"> 0.01 </td> <td style="text-align:right;"> 0.00 </td> <td style="text-align:right;"> -255.12 </td> <td style="text-align:right;"> 1.00 </td> </tr> <tr> <td style="text-align:left;"> 10 </td> <td style="text-align:left;"> Order 10 </td> <td style="text-align:right;"> 12 </td> <td style="text-align:right;"> 533.75 </td> <td style="text-align:right;"> 11.39 </td> <td style="text-align:right;"> 0.00 </td> <td style="text-align:right;"> 0.00 </td> <td style="text-align:right;"> -254.88 </td> <td style="text-align:right;"> 1.00 </td> </tr> </tbody> </table> .center[So... how much better are the top models? What about Parsimony? What would you say?] --- class: center, middle background-color:black # We Need an Ensemble  --- # Death to single models! - While sometimes the model you should use is clear, more often it is *not* - Further, you made those models for a reason: you suspect those terms are important - Better to look at coefficients across models - For actual predictions, ensemble predictions provide real uncertainty --- # Ensemble Prediction - Ensemble prediction gives us better uncertainty estimates - Takes relative weights of predictions into account - Takes weights of coefficients into account - Basicaly, get simulated predicted values, multiply them by model weight --- # Model Averaged Predictions ```r newData <- data.frame(temperature = mean(roaches$temperature)) ``` ``` Model-averaged predictions on the response scale based on entire model set and 95% confidence interval: mod.avg.pred uncond.se lower.CL upper.CL 1 98.22 5.949 86.56 109.88 ``` --- # Model Averaged Predictions for FULL UNCERTAINTY <img src="crossvalidation_files/figure-html/unnamed-chunk-7-1.png" style="display: block; margin: auto;" /> --- # Inferential Frameworks of Today - **Cross-Validation**: How good are you at predicting new data? - Deductive - Chose model with best predictive ability! - **Model Comparison**: Comparison of alternate hypotheses - Deductive or Inductive - Either compare models to elminiate poor fits - Or... compare multiple models to determine how a system works