Merging Data
- Problem: I have two data sets
- One is biological information
- One is physical information
- They have a common key - e.g., Lat/Long
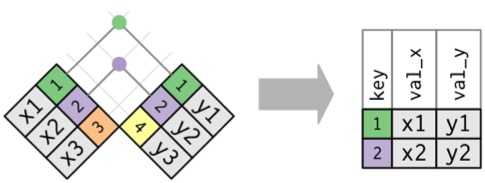
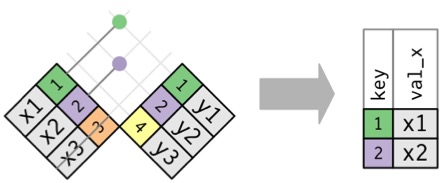
Join
![]()
The data
hemlock_data <- read_excel("lectures/data/18/hemlock.xlsx")

str(hemlock_data)
tibble [98 × 11] (S3: tbl_df/tbl/data.frame)
 $ Stand        : chr [1:98] "Athol 1" "Athol 2" "Athol 4" "Athol 6" ...
 $ Year         : num [1:98] 2003 2003 2003 2003 2004 ...
 $ Longitude    : num [1:98] -72.2 -72.2 -72.2 -72.2 -72.1 ...
 $ Latitude     : num [1:98] 42.5 42.5 42.5 42.6 42.6 ...
 $ Live BA      : num [1:98] 36.3 31.2 35.9 32.6 23 ...
 $ Dead Hem BA  : num [1:98] 0.46 0.46 0 0 0 2.87 0 0 0 1.15 ...
 $ Hem Vigor    : num [1:98] 1.6 1.18 1.47 1.86 1.25 1.9 1.91 1.56 1 1.81 ...
 $ Hem Den      : num [1:98] 1450 1250 900 725 600 725 825 450 400 925 ...
 $ Dead Hem Den : num [1:98] 50 50 0 50 0 150 50 50 0 100 ...
 $ Tree Den     : num [1:98] 2125 1725 1700 1100 1075 ...
 $ Borer Density: num [1:98] 0 0 0 0 0 0 0 0 0 0 ...
The problem
[1] 98
[1] 111
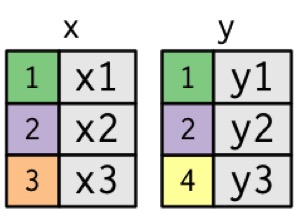
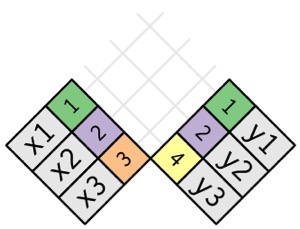
Mismatched Data Sets with Common Keys
![]()
Mismatched Data Sets with Common Keys
![]()
Inner Join
![]()
Creates new Data with rows that exist in both data sets
Reducing Data in Inner Joins
hem_inner <- inner_join(hemlock_data, hemlock_sites)
Joining with `by = join_by(Stand, Year, Longitude, Latitude)`
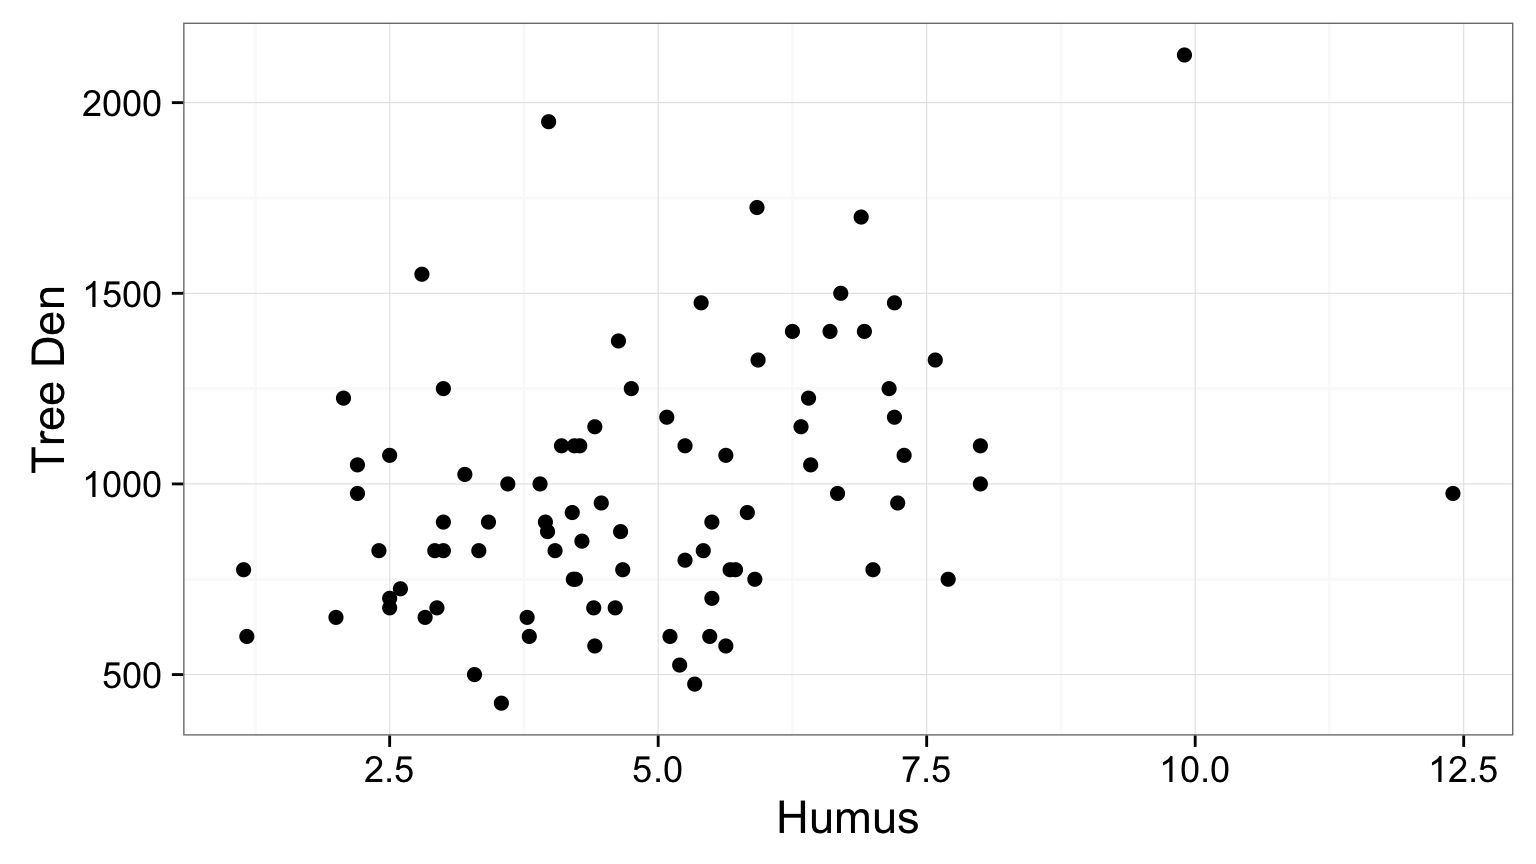
Plotting Paired Data
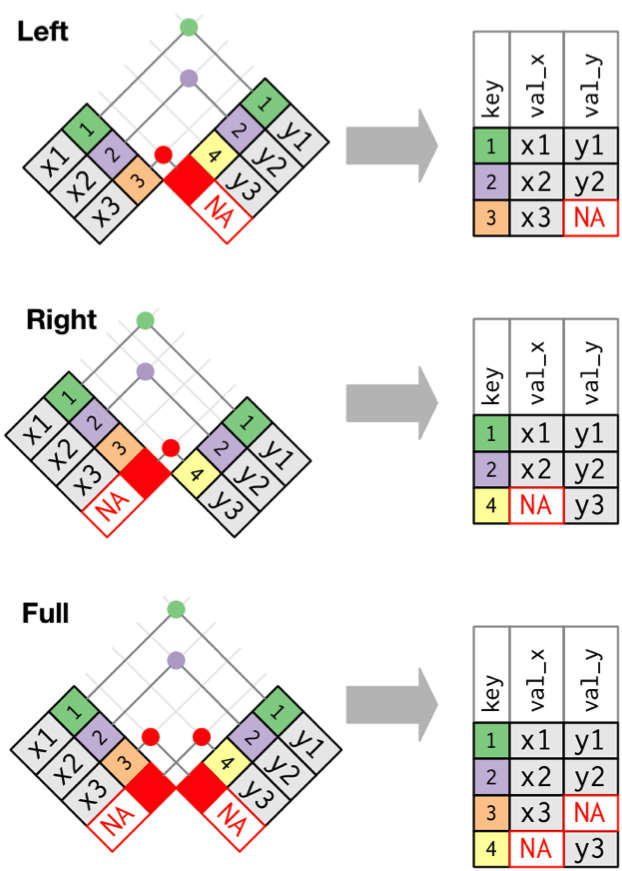
Outer Joins
![]()
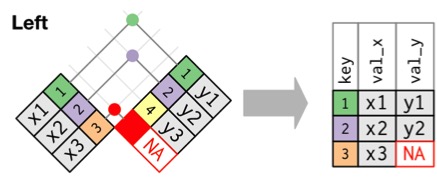
Left Join: Retain Rows with NAs in First Dataset
![]()
hem_left <- left_join(hemlock_data, hemlock_sites)
Joining with `by = join_by(Stand, Year, Longitude, Latitude)`
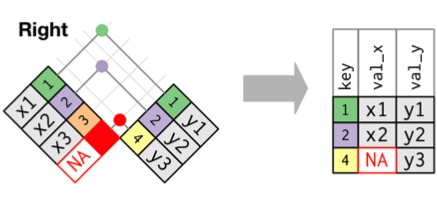
Right Join: Retain Rows with NAs in Second Dataset
![]()
hem_right <- right_join(hemlock_data, hemlock_sites)
Joining with `by = join_by(Stand, Year, Longitude, Latitude)`
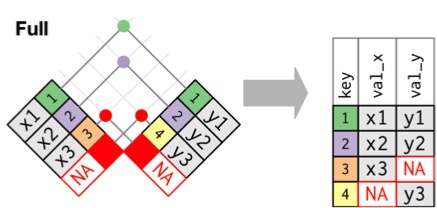
Full Join: Bring it All Together
![]()
Good to see the full dataset
hem_full <- full_join(hemlock_data, hemlock_sites)
Joining with `by = join_by(Stand, Year, Longitude, Latitude)`
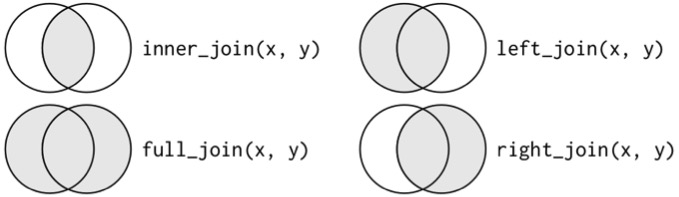
The Joins
![]()
Filtering Joins
- I only want data that matches a set of criteria
- Like outer joins with a second na.omit step
Semi Join: X %in% Y
![]()
Good before data pre-processing
hem_semi <- semi_join(hemlock_data, hemlock_sites)
Joining with `by = join_by(Stand, Year, Longitude, Latitude)`
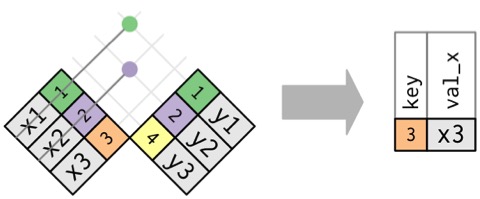
Anti Join: X NOT %in% Y
![]()
Good for diagnosing data mismatch
hem_anti <- anti_join(hemlock_data, hemlock_sites)
Joining with `by = join_by(Stand, Year, Longitude, Latitude)`
Exercise 1
- You want to plot a map of the sites
- You want size of points to be area
- You want color of points to be dead Hemlock area
Exercise 2
- You want to plot a map of the sites
- BUT - you want to show which sites are missing environmental
data
- AND - you want to show which sites are missing biological data
- (this might be more than one plot and more than one data join!)