Review
Testing Hypotheses with P-Values
Z, T, and \(\chi^2\) tests for hypothesis testing
Power of different statistical tests using simulation
Today
Correlation
Mechanics of Simple Linear Regression
Testing Asssumptions of SLR
The Steps of Statistical Modeling
- What is your question?
- What model of the world matches your question?
- Build a test
- Evaluate test assumptions
- Evaluate test results
- Visualize
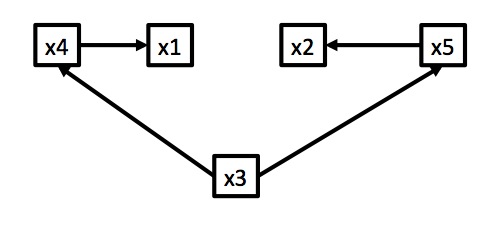
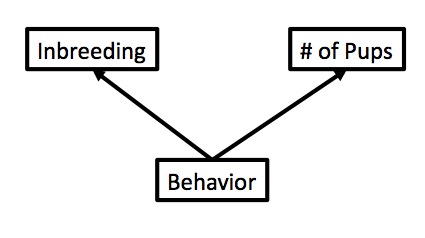
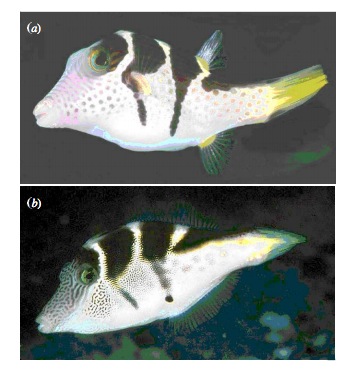
Example: Wolf Inbreeding and Litter Size
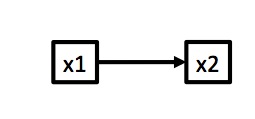
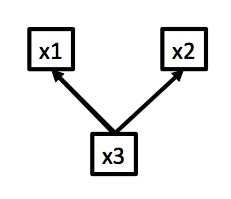
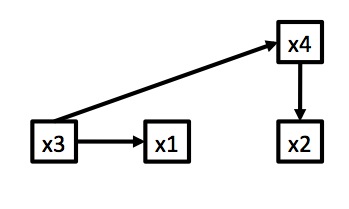
Example: Wolf Inbreeding and Litter Size
![image]()
![image]()
We don’t know which is correct - or if another model is better. We can only examine correlation.
What is Correlation?
- The porportion change in standard deviations of variable x per change in 1 SD of variable y
- Clear, right?
- And that’s just for normal, linear variables
- Assesses the degree of association between two variables
- But, unitless (sort of)
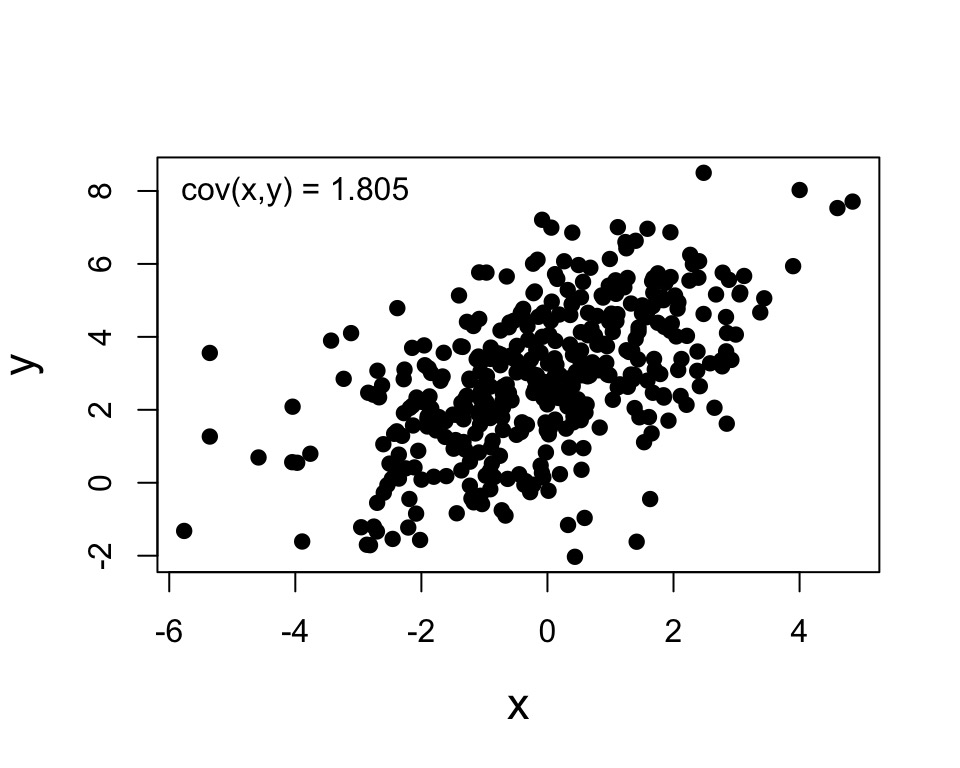
Calculating Correlation: Start with Covariance
Describes the relationship between two variables. Not scaled.
\(\sigma_{xy}\) = population level covariance
\(s_{xy}\) = covariance in your sample
\[\sigma_{XY} = \frac{\sum (X-\bar{X})(y-\bar{Y})}{n-1}\]
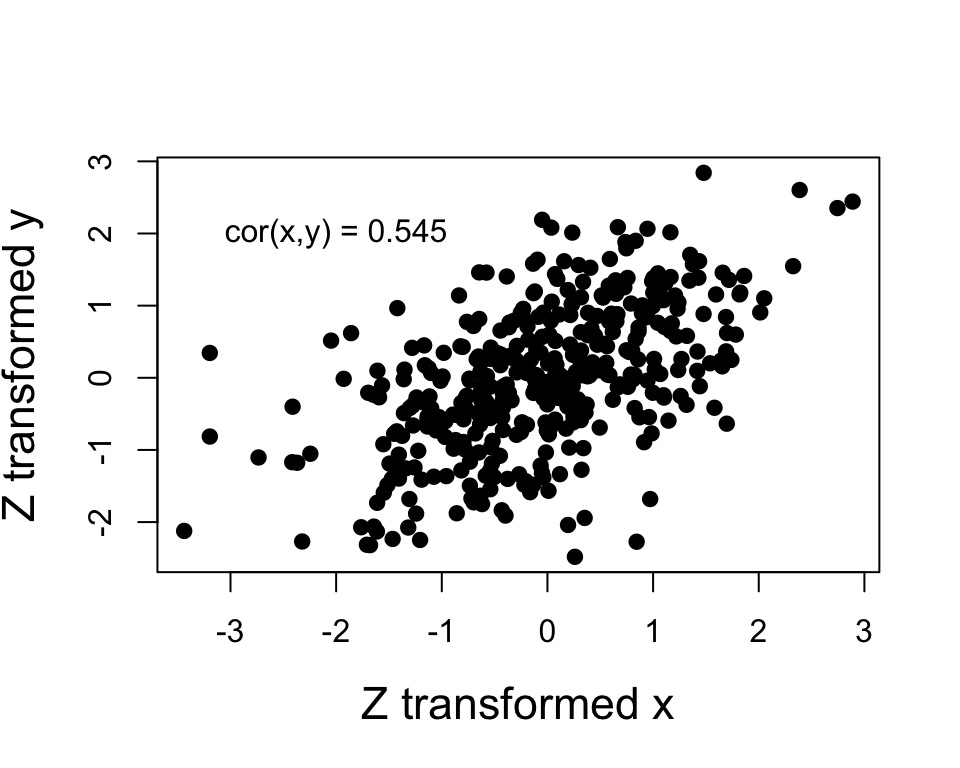
Pearson Correlation
Describes the relationship between two variables.
Scaled between -1 and 1.
\(\rho_{xy}\) = population level correlation, \(r_{xy}\) = correlation in your sample
\[\Large\rho_{xy} = \frac{\sigma_{xy}}{\sigma_{x}\sigma_{y}}\]
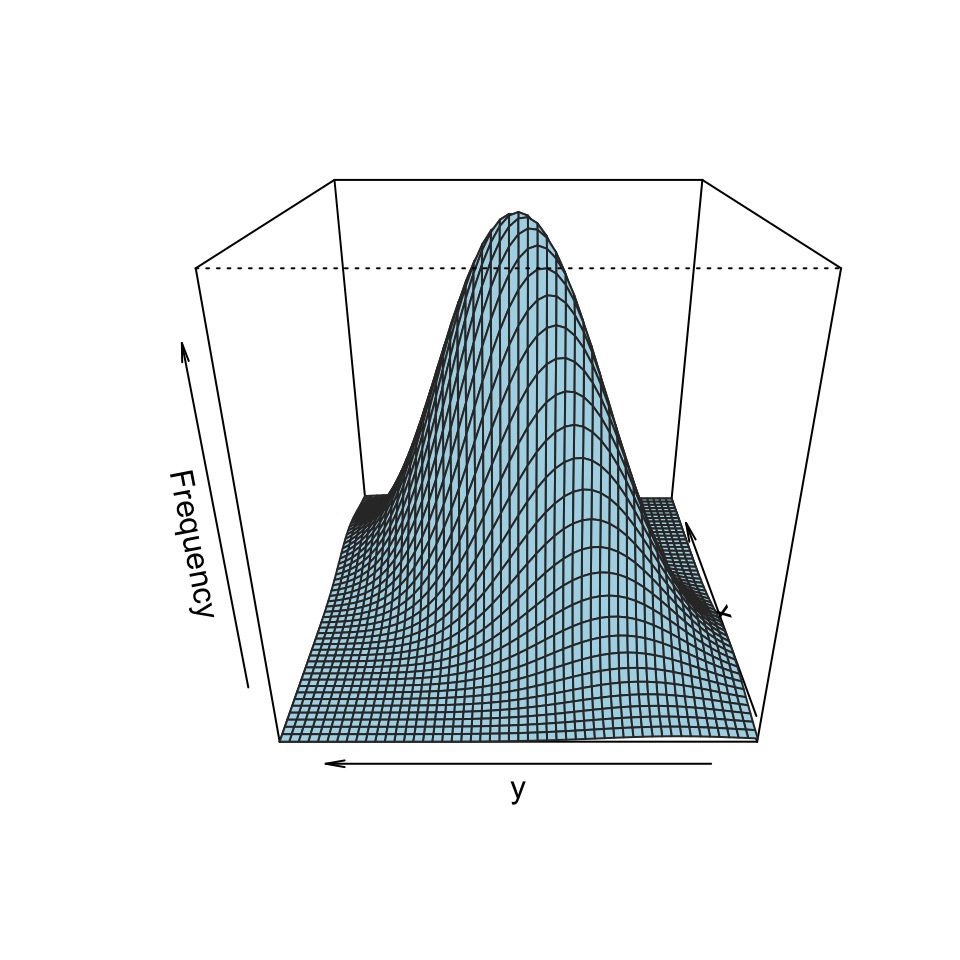
Assumptions of Pearson Correlation
- Observations are from a random sample
- Each observation is independent
- X and Y are from a Normal Distribution
The meaning of r
Y is perfectly predicted by X if r = -1 or 1.
\(r^2\) = the porportion of variation in y explained by x 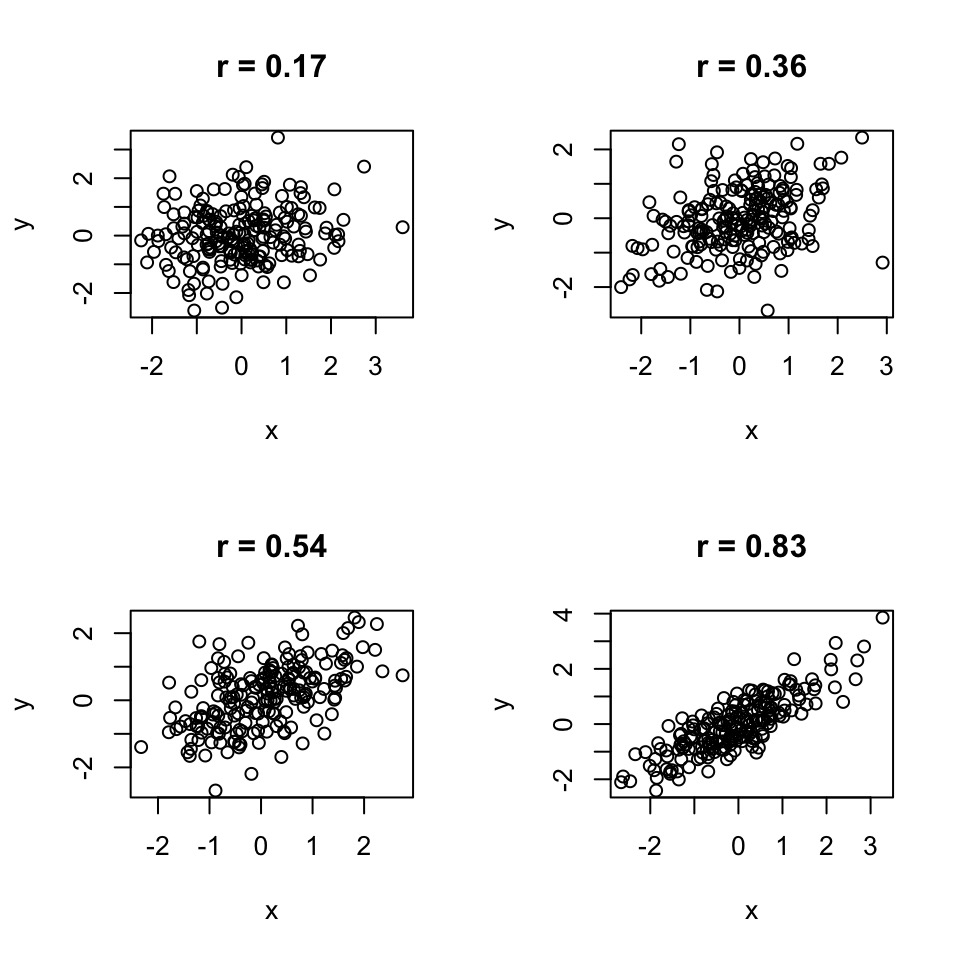
Testing if r \(\ne\) 0
Ho is r=0. Ha is r \(\ne\) 0.
Testing: \(t= \frac{r}{SE_{r}}\) with df=n-2
WHY n-2?
\(\sigma_{xy}\) Because you use two parameters: \(\bar{X}\) and \(\bar{Y}\)
\[SE_{r} = \sqrt{\frac{1-r^2}{n-2}}\]
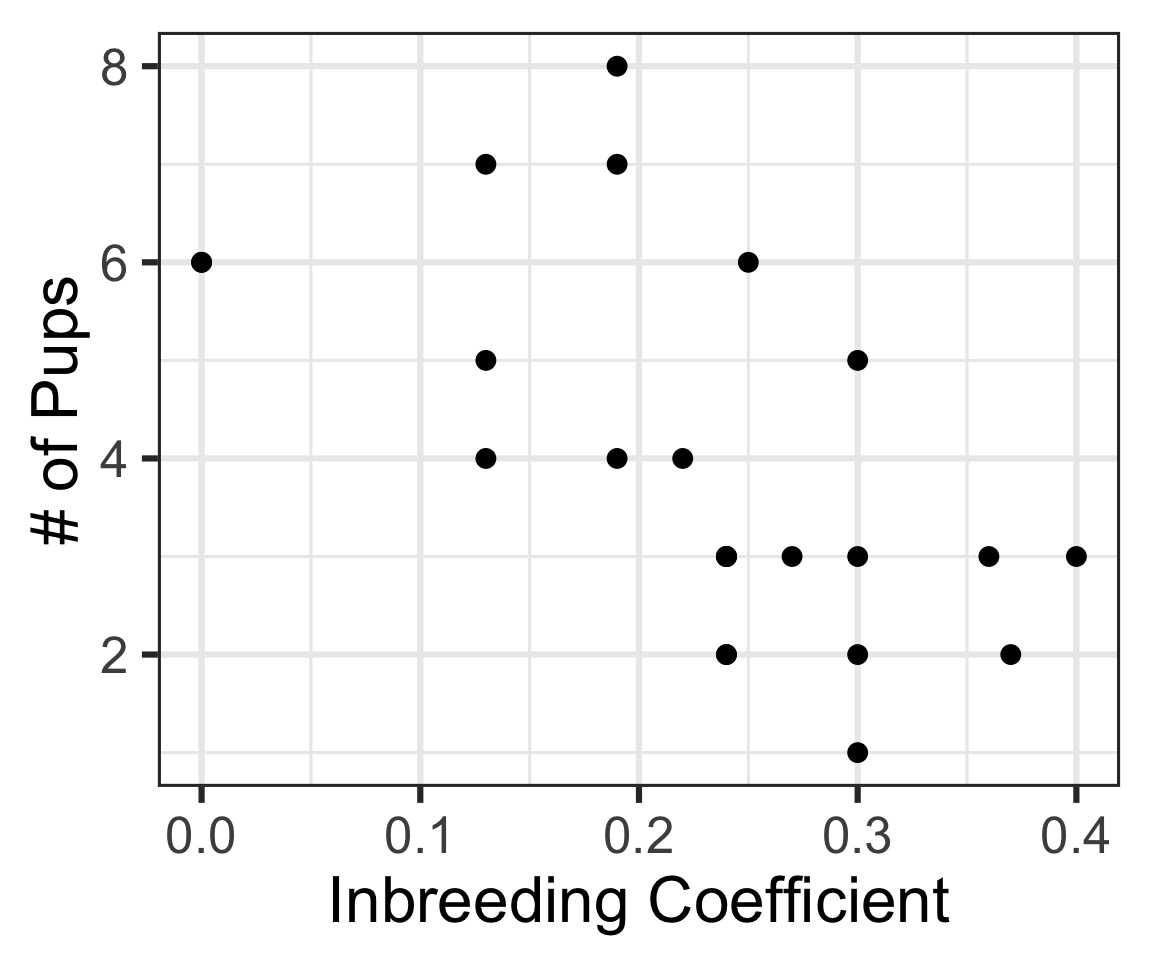
Example: Wolf Inbreeding and Litter Size
Example: Wolf Inbreeding and Litter Size
                       inbreeding.coefficient  pups
inbreeding.coefficient                   0.01 -0.11
pups                                    -0.11  3.52
                       inbreeding.coefficient  pups
inbreeding.coefficient                   1.00 -0.61
pups                                    -0.61  1.00
|
estimate
|
statistic
|
p.value
|
parameter
|
|
-0.608
|
-3.589
|
0.002
|
22
|
Violating Assumptions?
- Spearman’s Correlation (rank based)
- Distance Based Correlation & Covariance (dcor)
- Maximum Information Coefficient (nonparametric)
- All are lower in power for linear correlations
Spearman Correlation
Transform variables to ranks, i.e.,2,3… (rank())
Compute correlation using ranks as data
If n \(\le\) 100, use Spearman Rank Correlation table
If n \(>\) 100, use t-test as in Pearson correlation
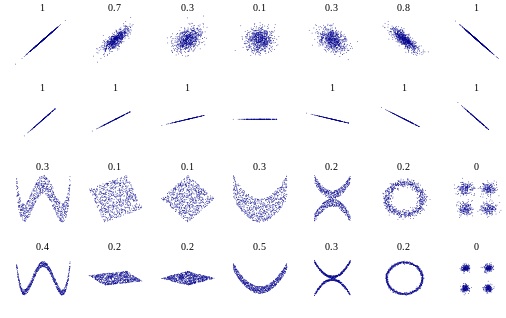
Distance Based Correlation, MIC, etc.
![image]()
Today
Correlation
Mechanics of Simple Linear Regression
Testing Asssumptions of SLR
Least Squares Regression
\(\Large \widehat{y} = \beta_0 + \beta_1 x + \epsilon\)
Then it’s code in the data, give the keyboard a punch
Then cross-correlate and break for some lunch
Correlate, tabulate, process and screen
Program, printout, regress to the mean
-White Coller Holler by Nigel Russell
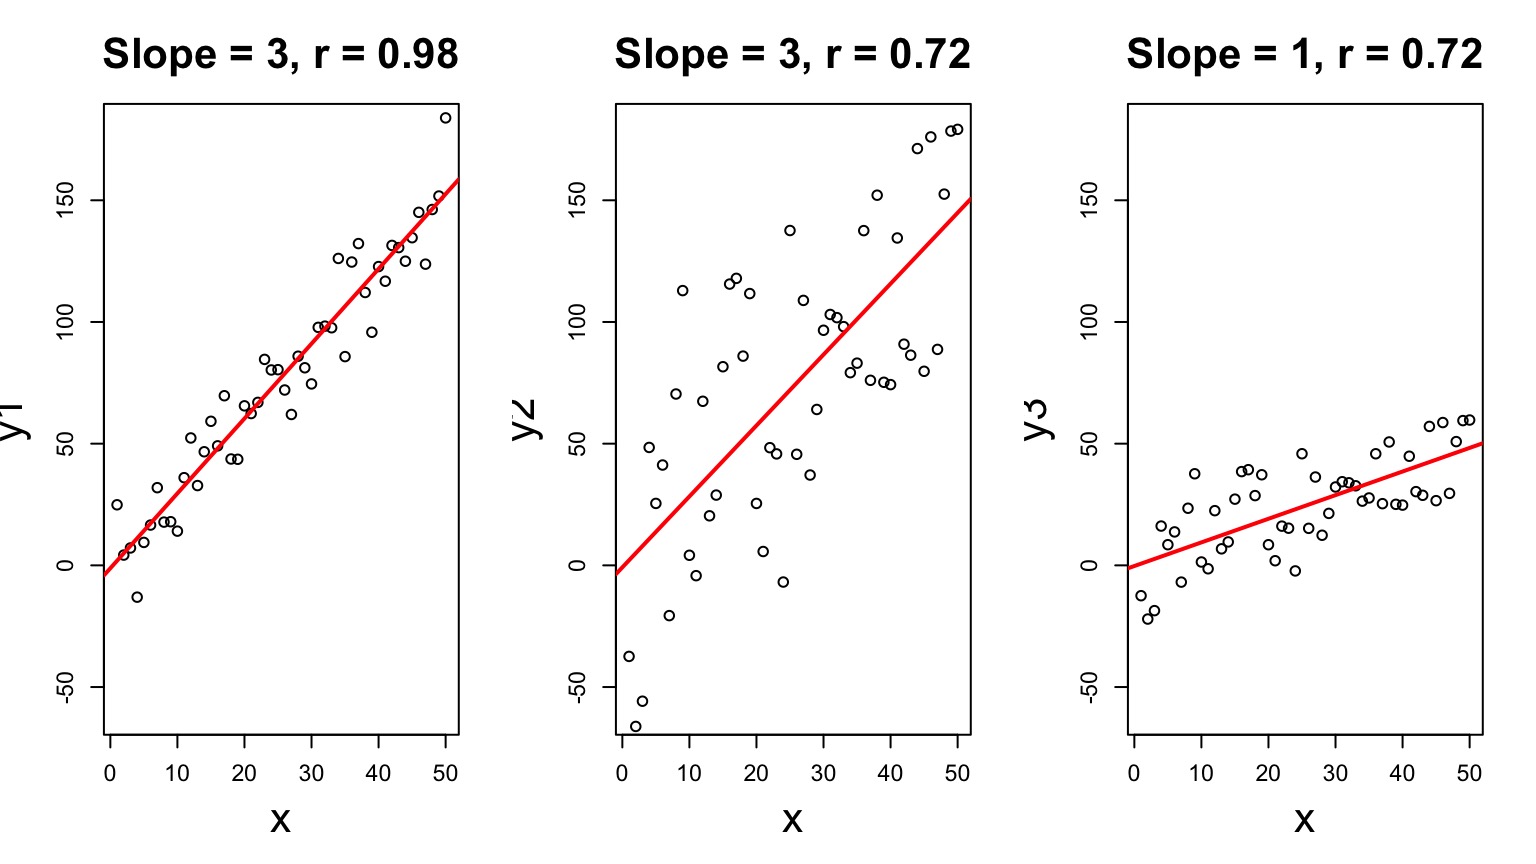
Correlation v. Regression Coefficients
Basic Princples of Linear Regression
- Y is determined by X: p(Y \(|\) X=x)
- The relationship between X and Y is Linear
- The residuals of \(\widehat{Y} = \beta_0 + \beta_1 X + \epsilon\) are normally distributed
(i.e., \(\epsilon \sim\) N(0,\(\sigma\)))
Basic Principles of Least Squares Regression
\(\widehat{Y} = \beta_0 + \beta_1 X + \epsilon\) where \(\beta_0\) = intercept, \(\beta_1\) = slope
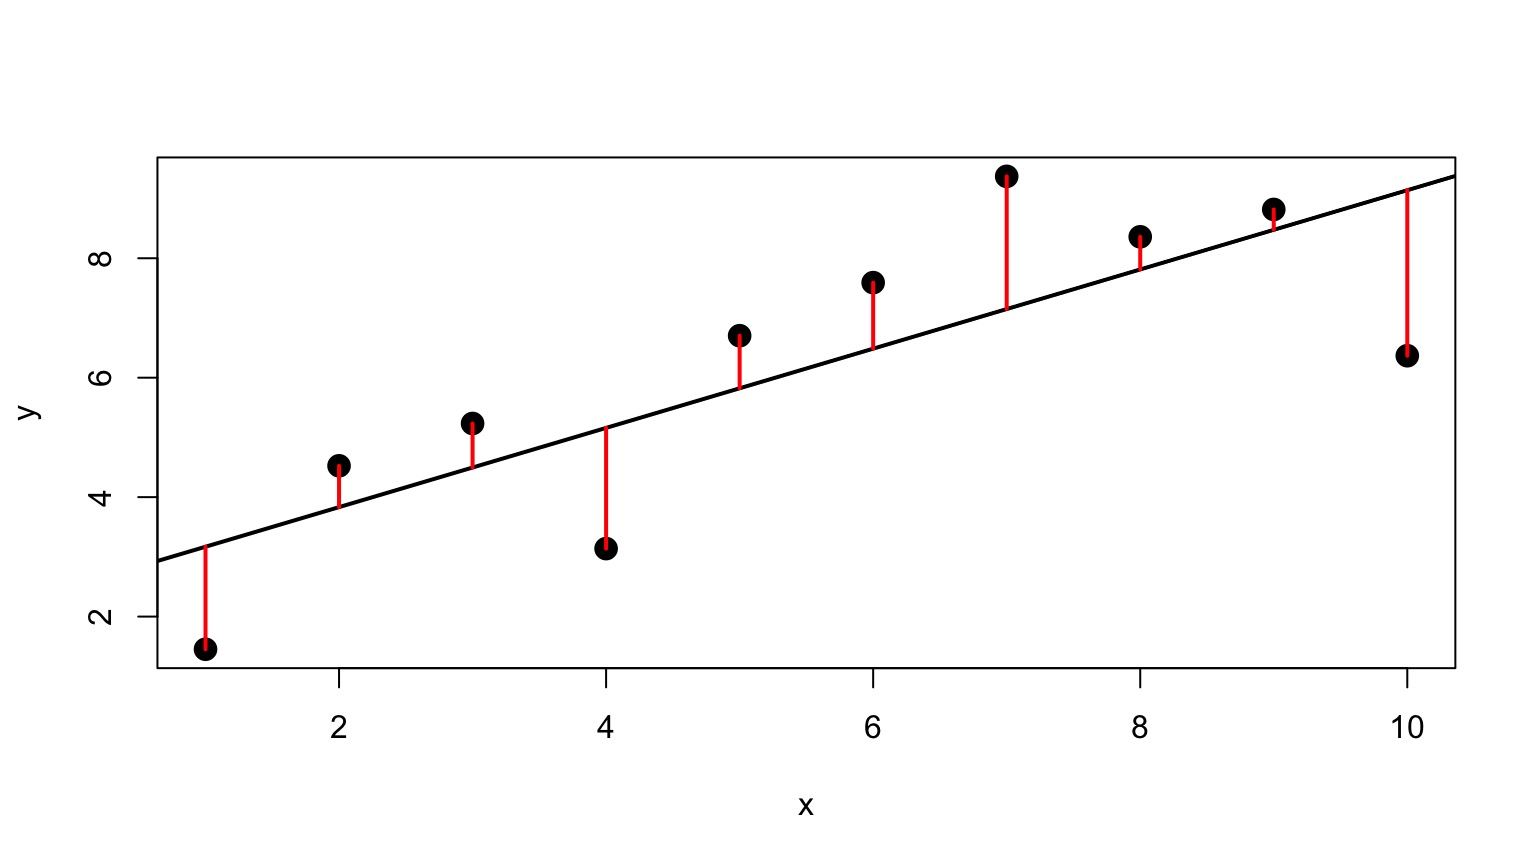
Minimize Residuals defined as \(SS_{residuals} = \sum(Y_{i} - \widehat{Y})^2\)
Lots of Possible Lines: Least Squares
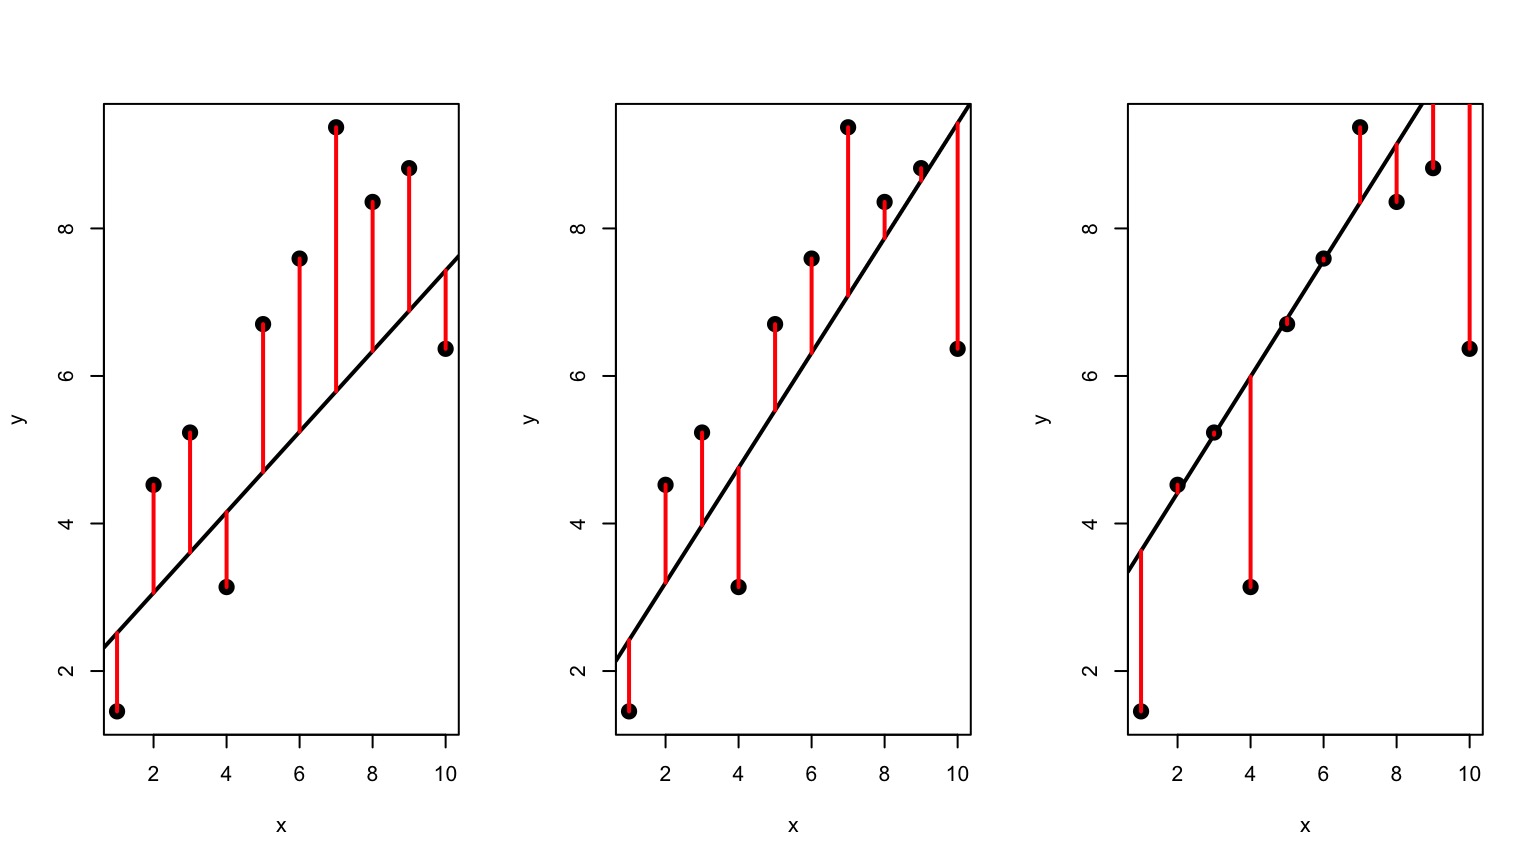
Solving for Slope
\(\LARGE b=\frac{s_{xy}}{s_{x}^2}\) \(= \frac{cov(x,y)}{var(x)}\)
\(\LARGE = r_{xy}\frac{s_{y}}{s_{x}}\)
Solving for Intercept
Least squares regression line always goes through the mean of X and Y
\(\Large \bar{Y} = \beta_0 + \beta_1 \bar{X}\)
\(\Large \beta_0 = \bar{Y} - \beta_1 \bar{X}\)
Putting Linear Regression Into Practice with Pufferfish
- Pufferfish are toxic/harmful to predators
- Batesian mimics gain protection from predation - why?
- Evolved response to appearance?
- Researchers tested with mimics varying in toxic pufferfish resemblance
The Steps of Statistical Modeling
- What is your question?
- What model of the world matches your question?
- Build a test
- Evaluate test assumptions
- Evaluate test results
- Visualize
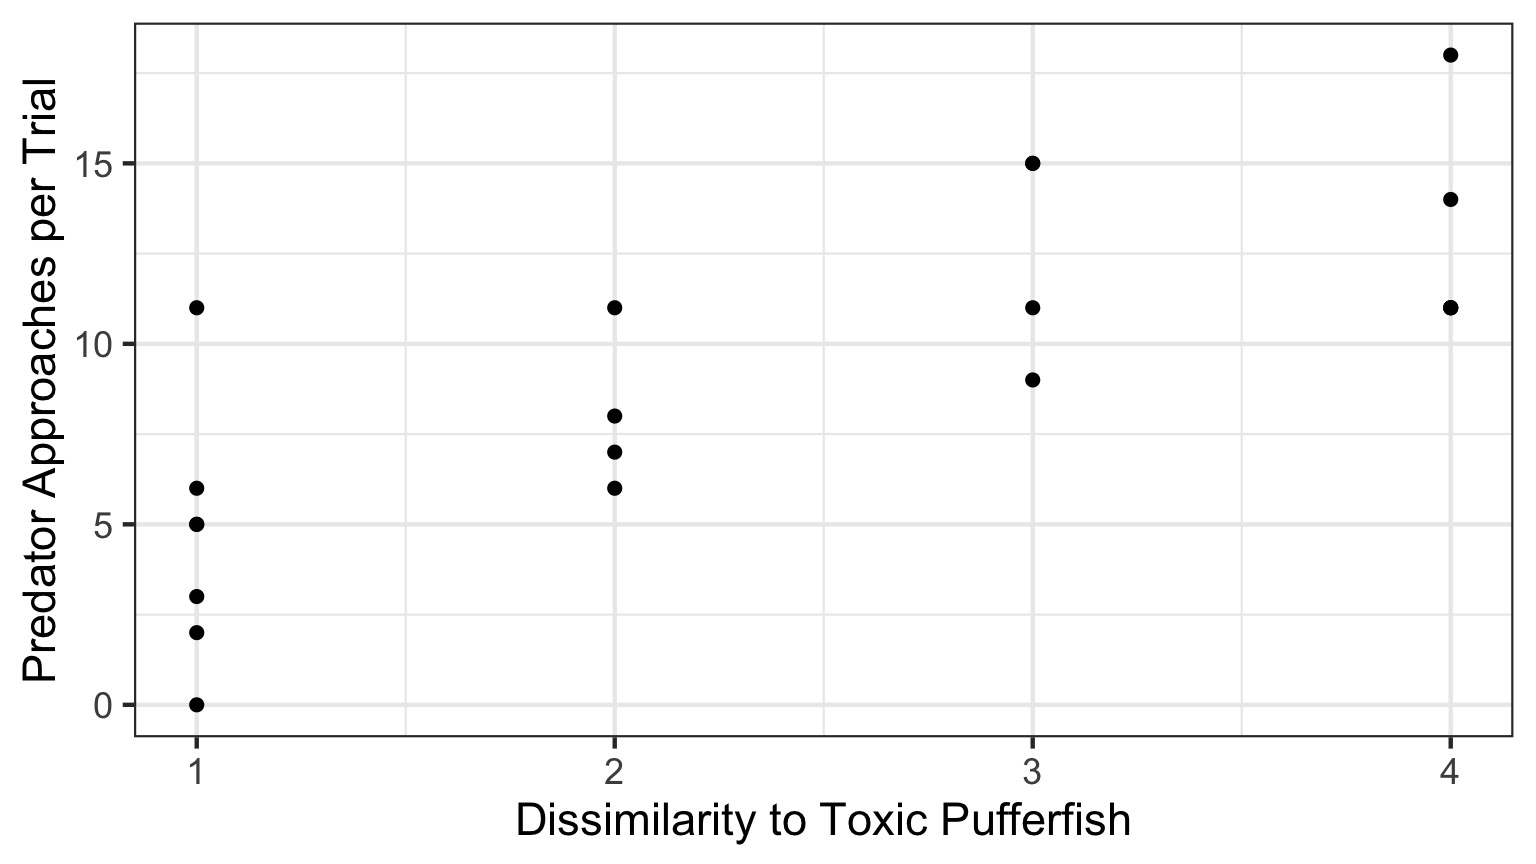
Question: Does Resembling a Pufferfish Reduce Predator Visits?
A Preview: But How do we Get Here?
The World of Pufferfish
Data Generating Process:
\[Visits \sim Resemblance\]
Assume: Linearity (reasonable first approximation)
Error Generating Process:
Variation in Predator Behavior
Assume: Normally distributed error (also reasonable)
Quantiative Model of Process
\[\Large Visits_i = \beta_0 + \beta_1 Resemblance_i + \epsilon_i\]
\[\Large \epsilon_i \sim N(0, \sigma)\]
Today
Correlation
Mechanics of Simple Linear Regression
Testing Asssumptions of SLR
Testing Assumptions
- Data Generating Process: Linearity
- Examine relationship between fitted and observed values
- Secondary evaluation: fitted v. residual values
- Error Generating Process: Normality & homoscedasticity of residuals
- Histogram of residuals
- QQ plot of residuals
- Levene test if needed
- Data
- Do we have any outliers with excessive leverage?
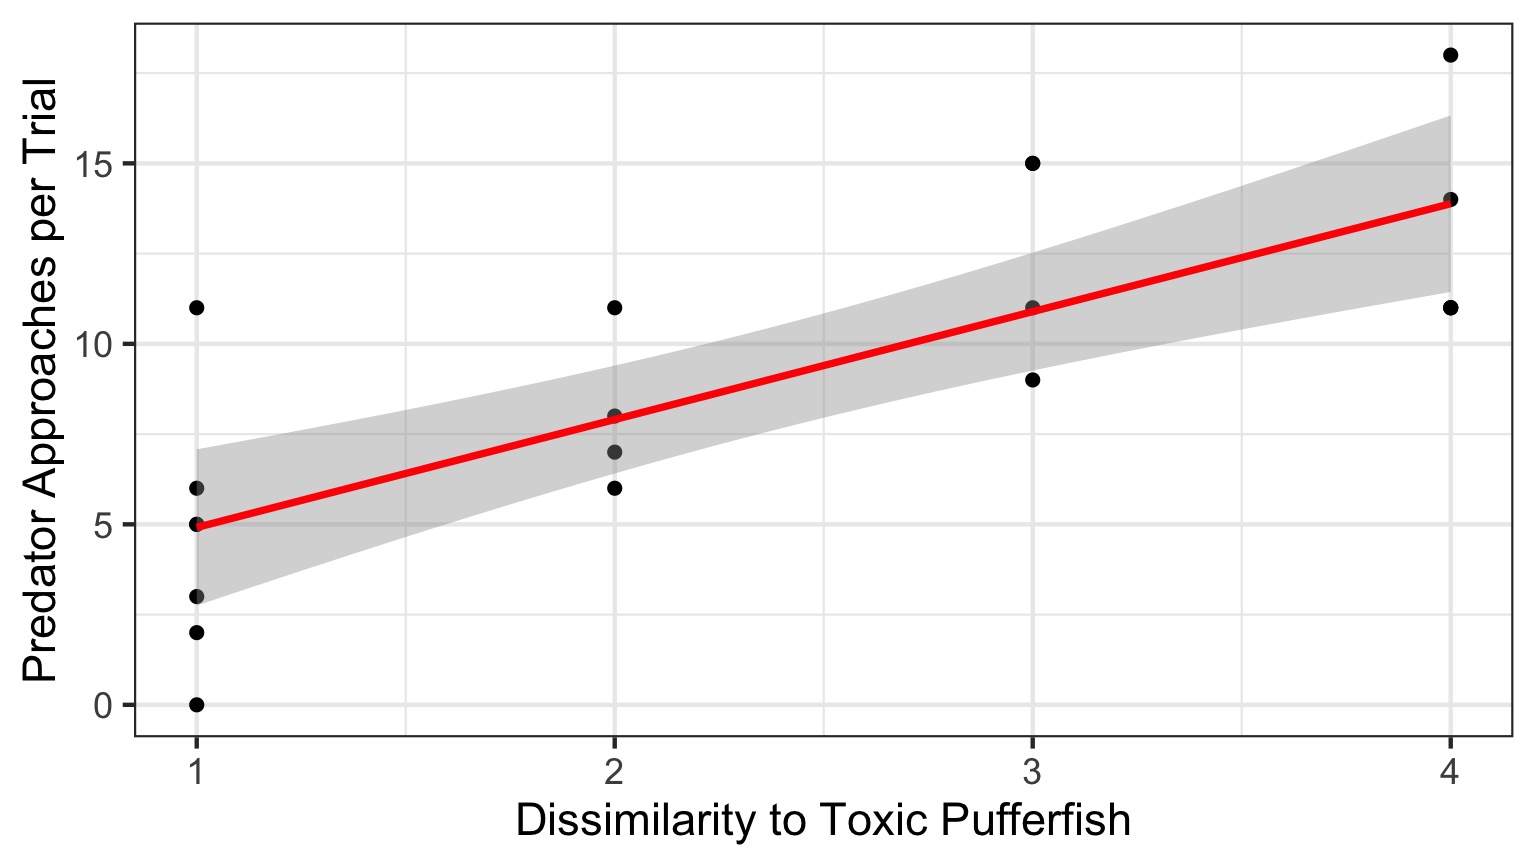
Linearity of the Puffer Relationship
Fitted v. Observed
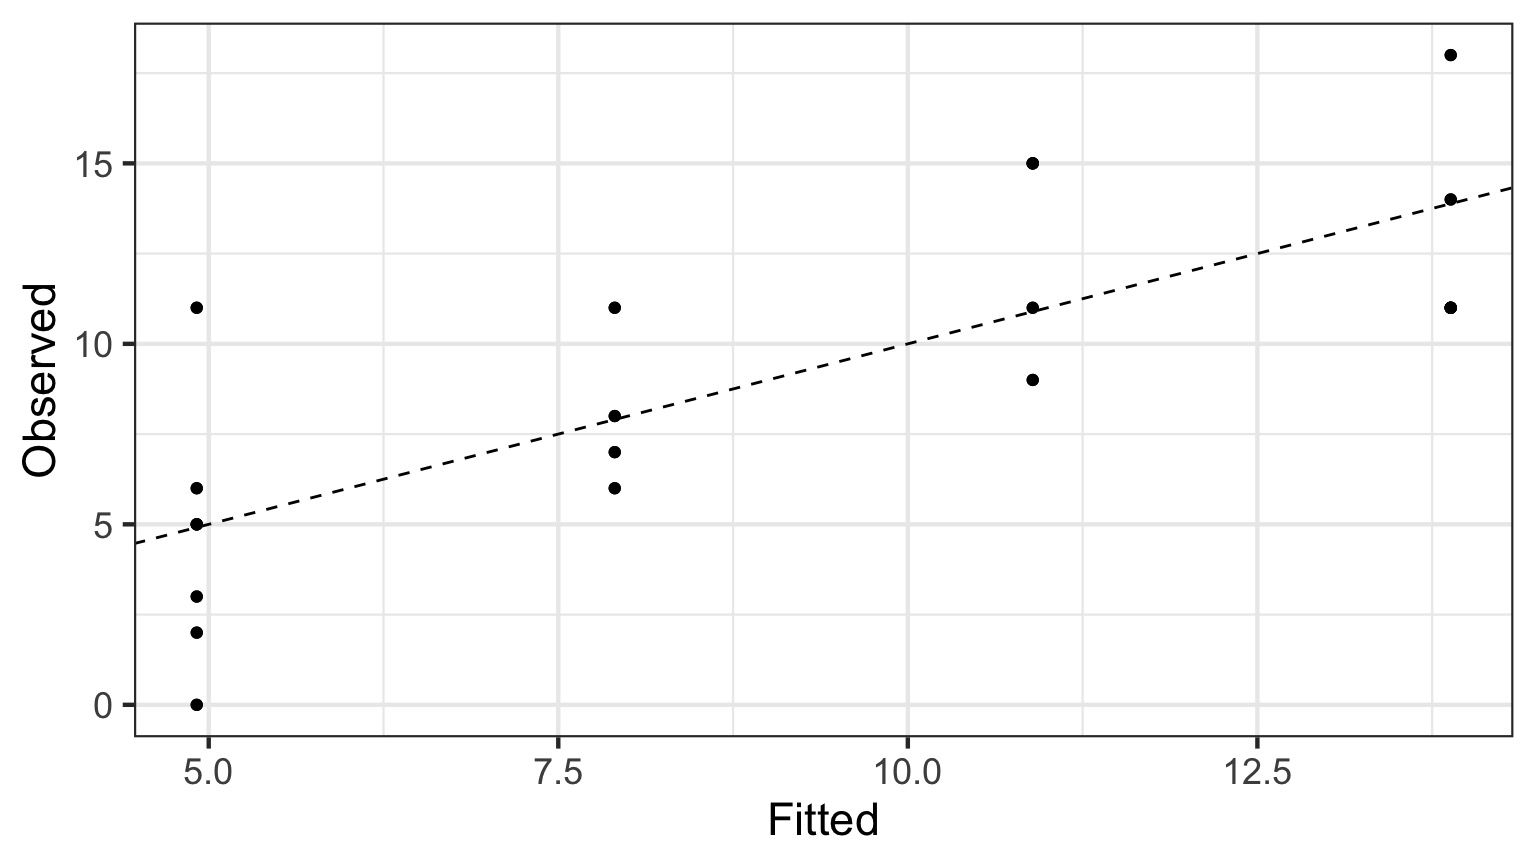
Points fall on 1:1 line, no systematic deviations
Linearity and Homoscedasticity of the Puffer Relationship
Fitted v. Residual
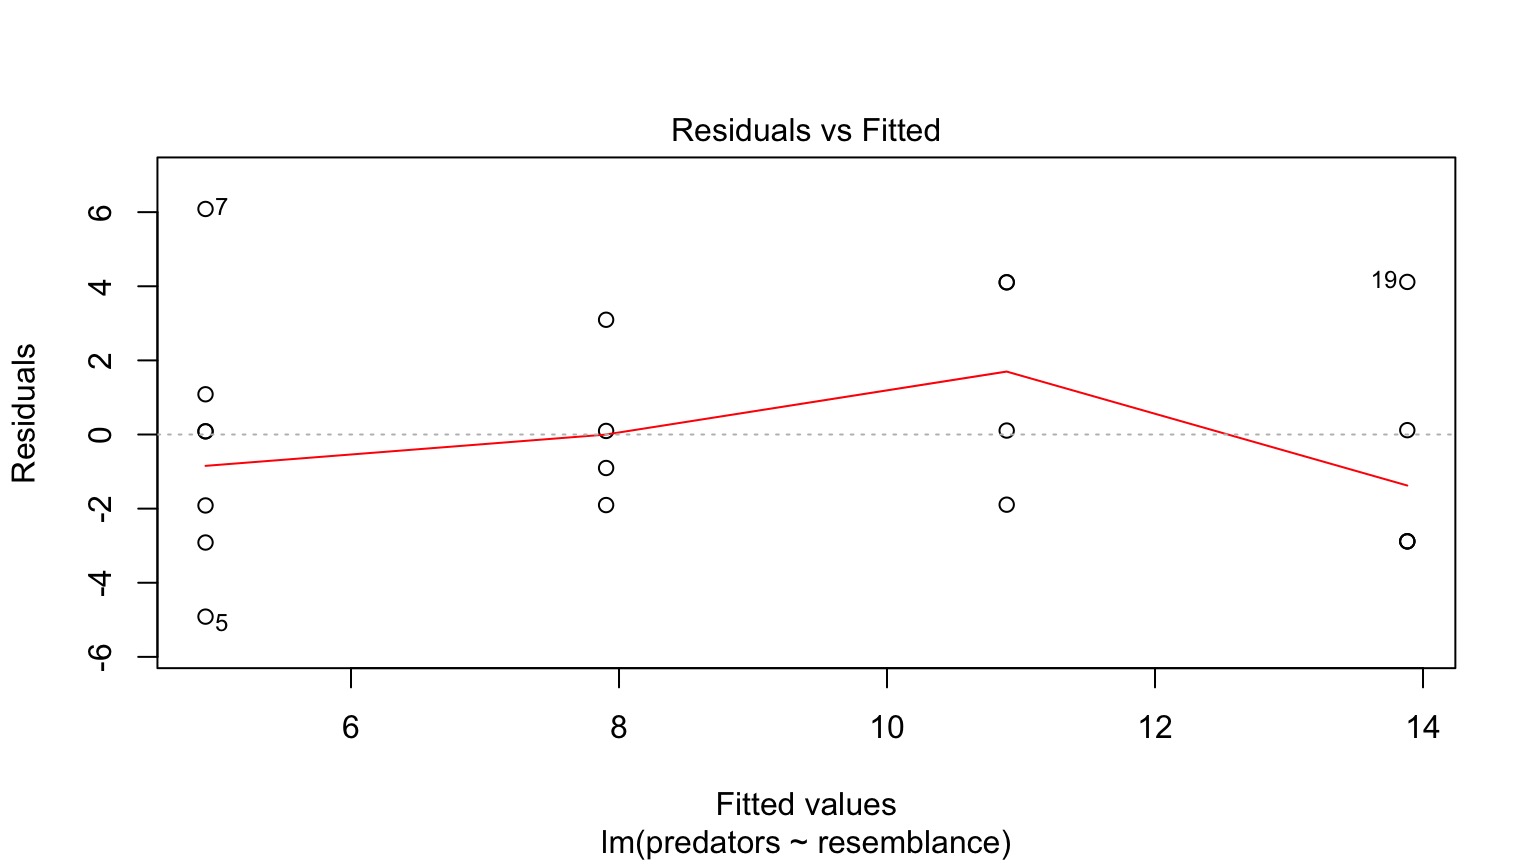
No systematic trends in relationship required!
Normality of Residuals
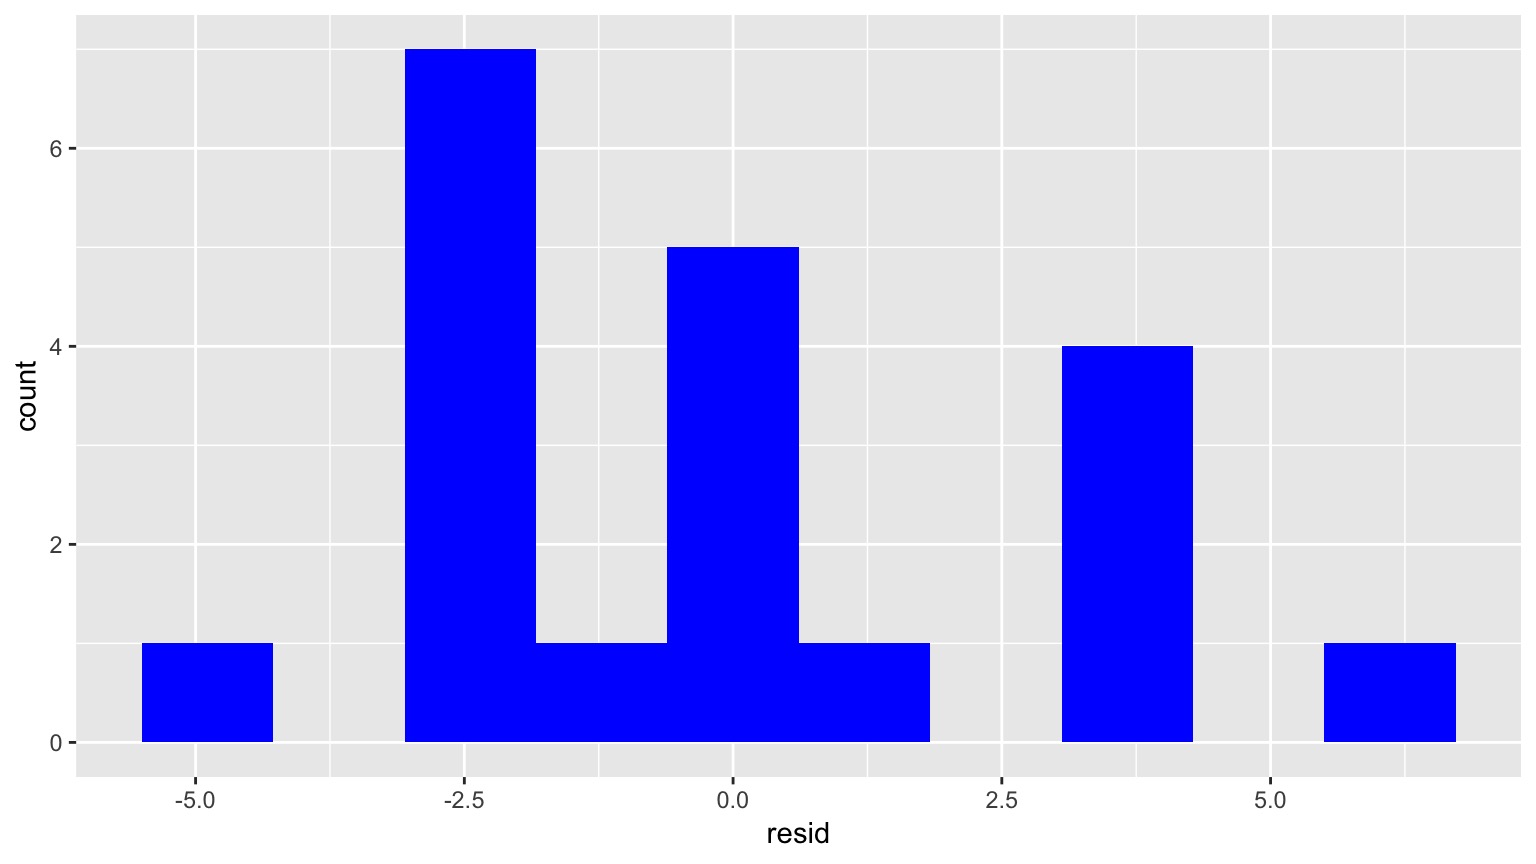
Appears peaked in the middle…
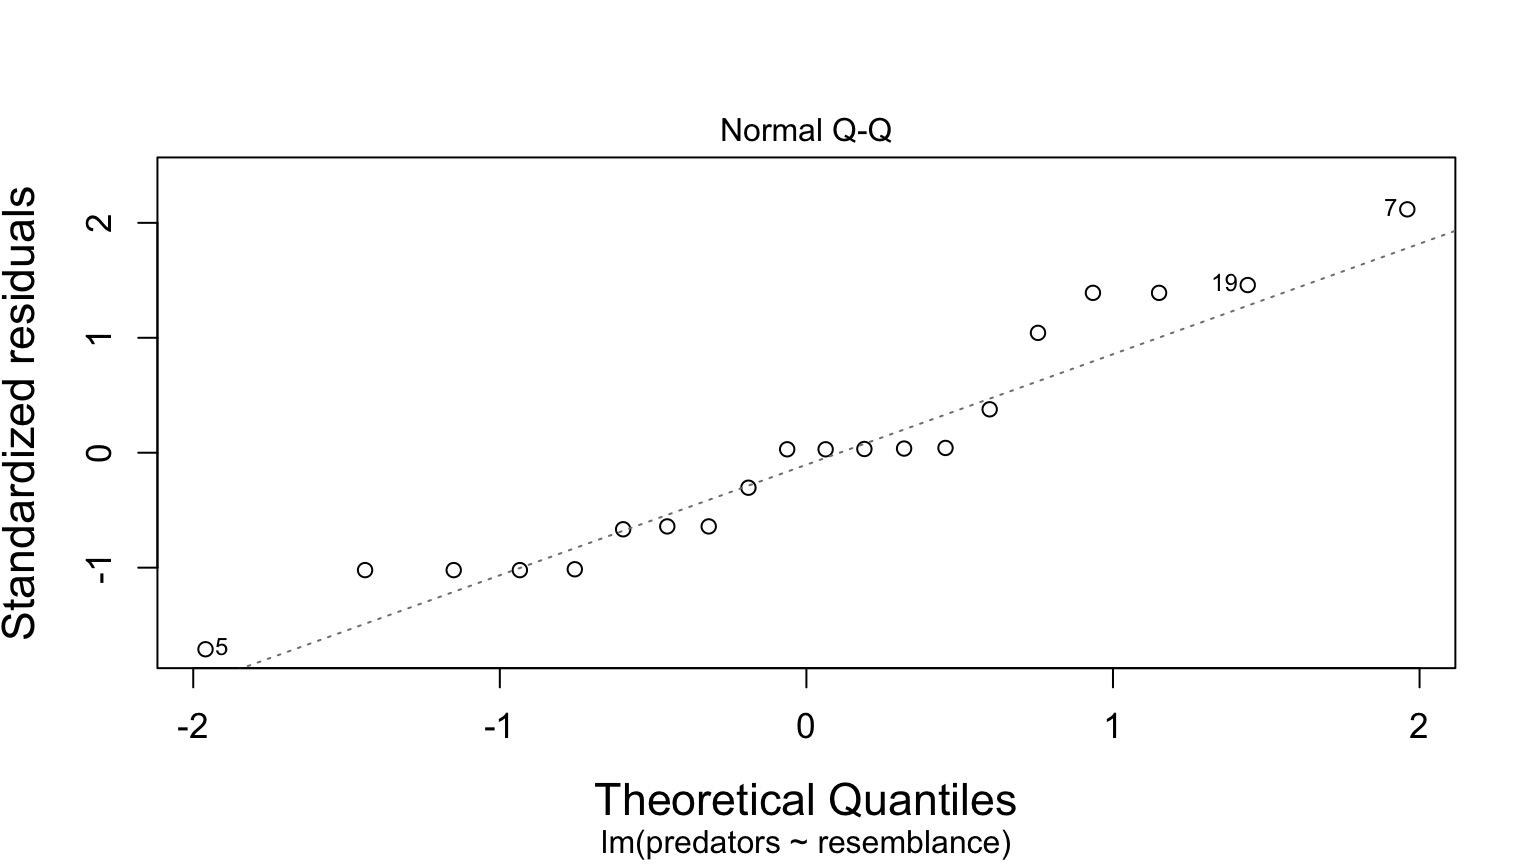
Normality of Residuals
QQ Plot!
Any Excessive Outliers?
Cook’s Distance
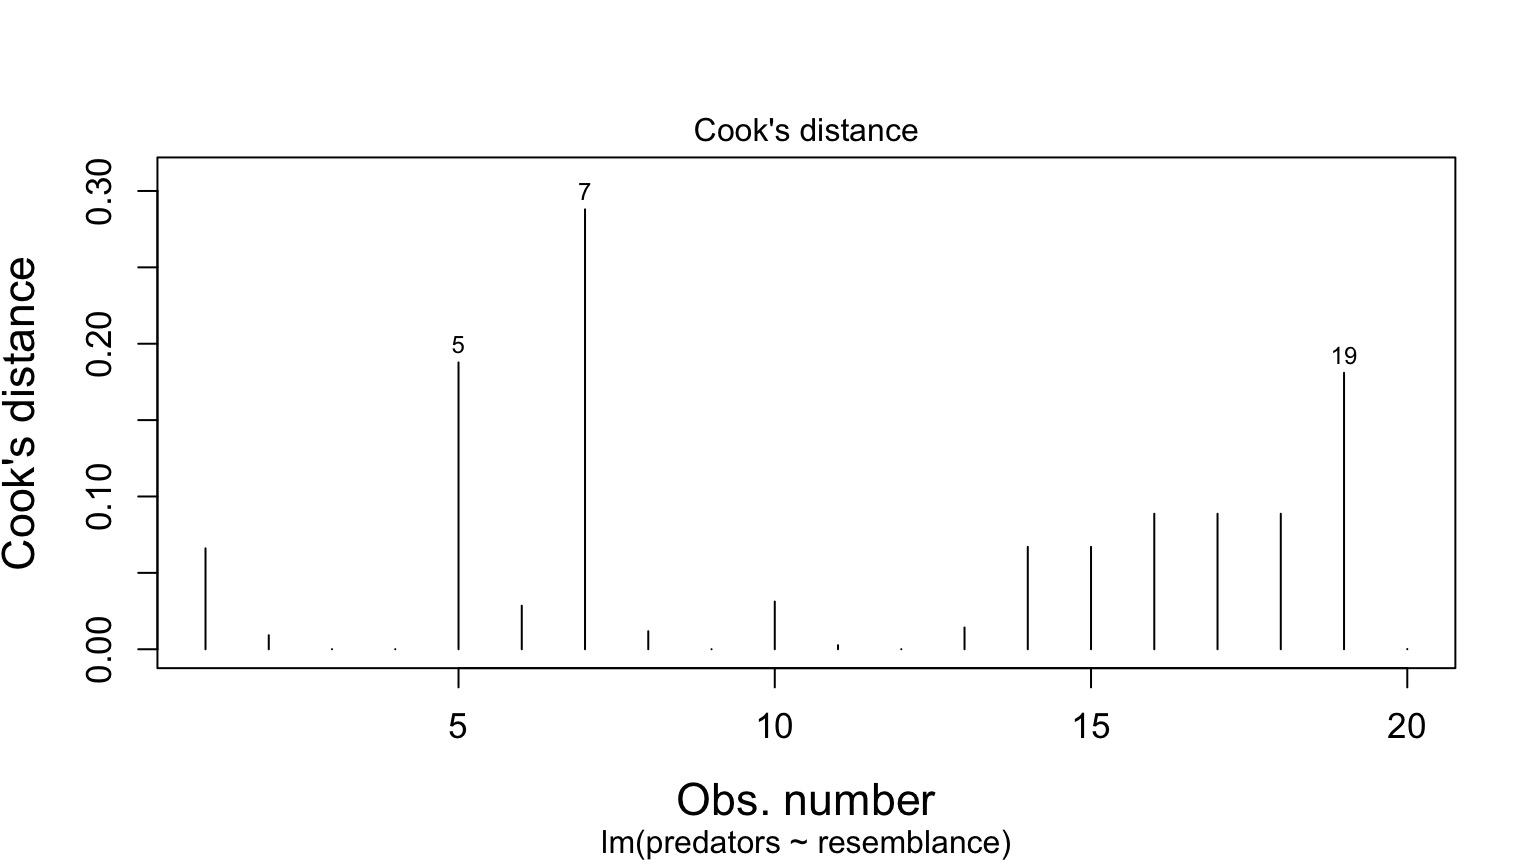
Nothing with > 1
Anything Too Influential
Leverage: How Far is an Observation from the Others
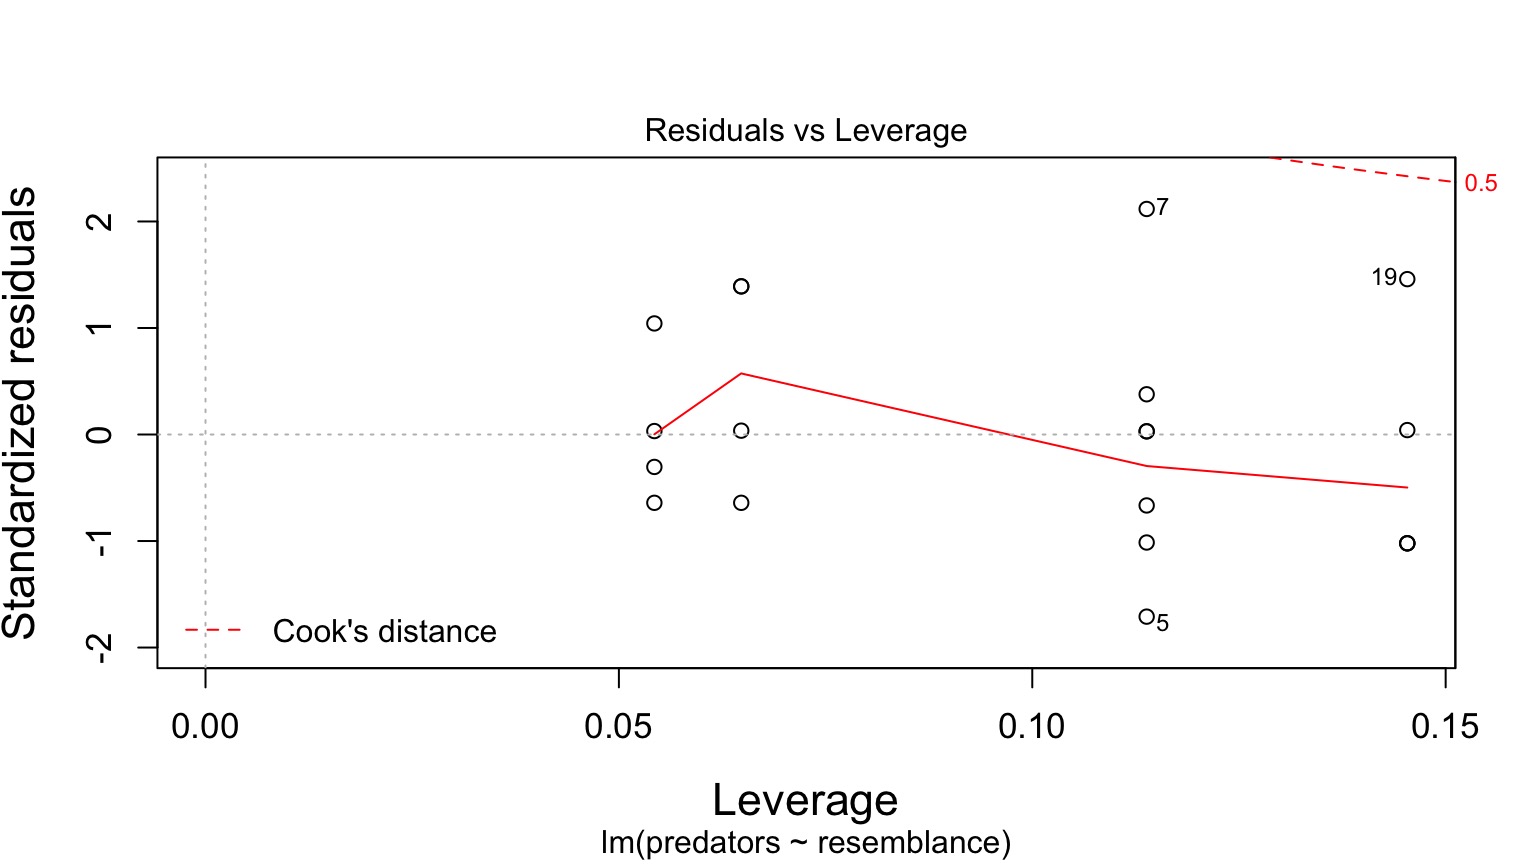
Should be a cloud with no trend