Statistical Golems
This is a Golem
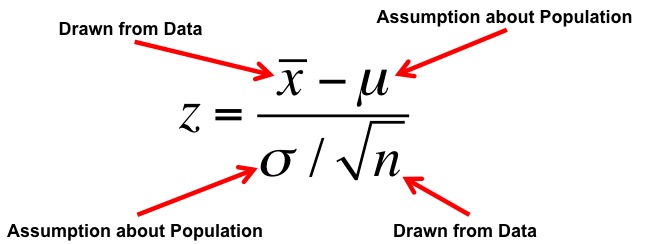
\[\LARGE z = \frac{\bar{X} - \mu}{\sigma/\sqrt{n}}\]
- What is my data generating process?
- What is my error generating process?
What Drives my Golem?
Is this a Good Golumn for Realistic Sample Sizes?
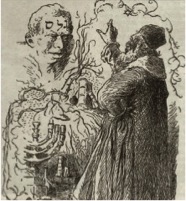
With your sample size, might you burn down Prague?
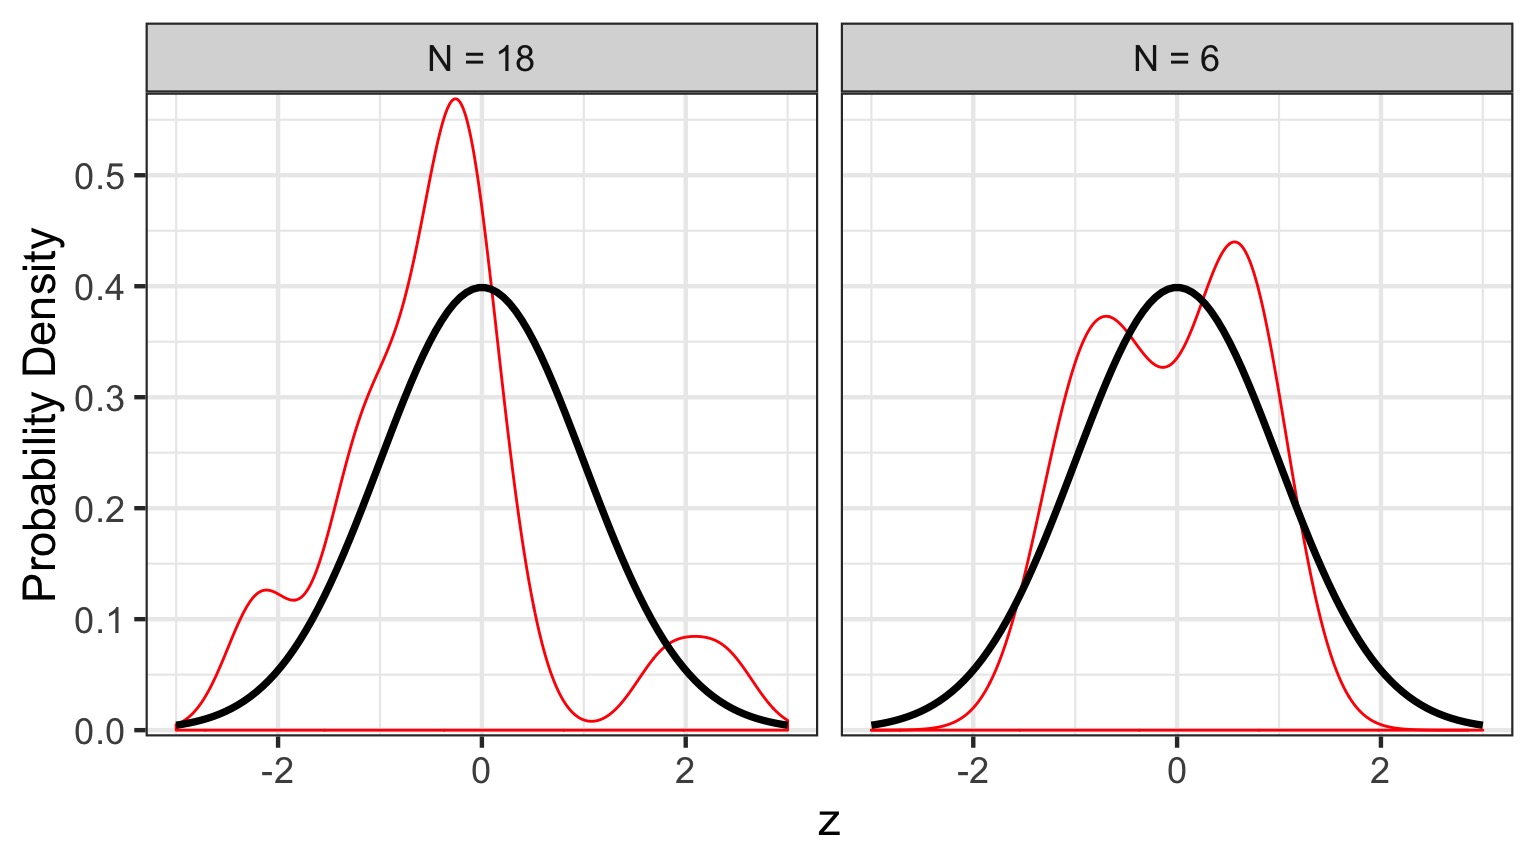
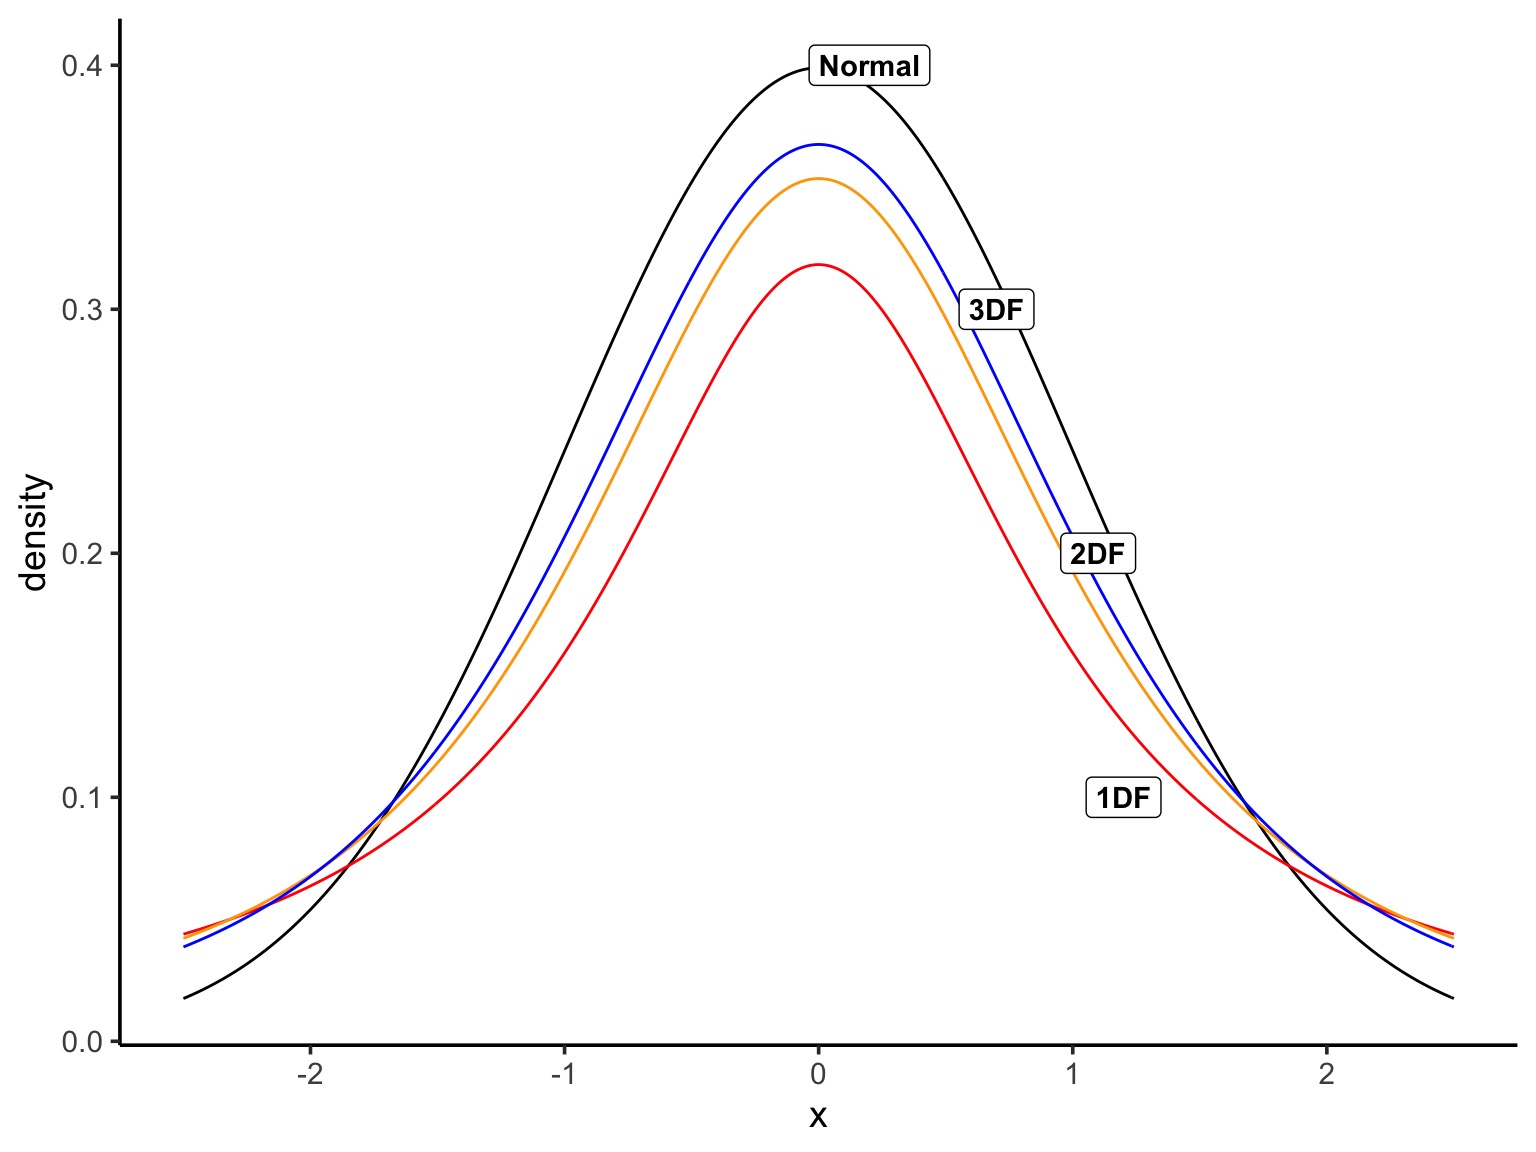
- Fat tails, leptokurtic, but better with higher n
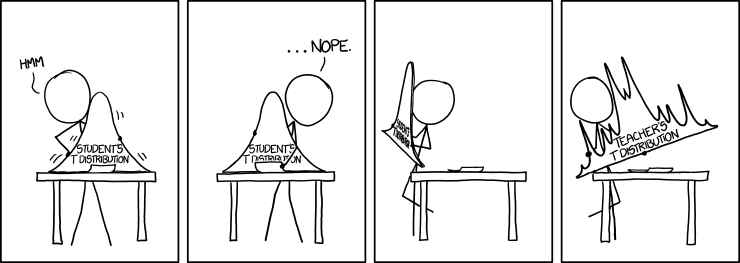
xkcd
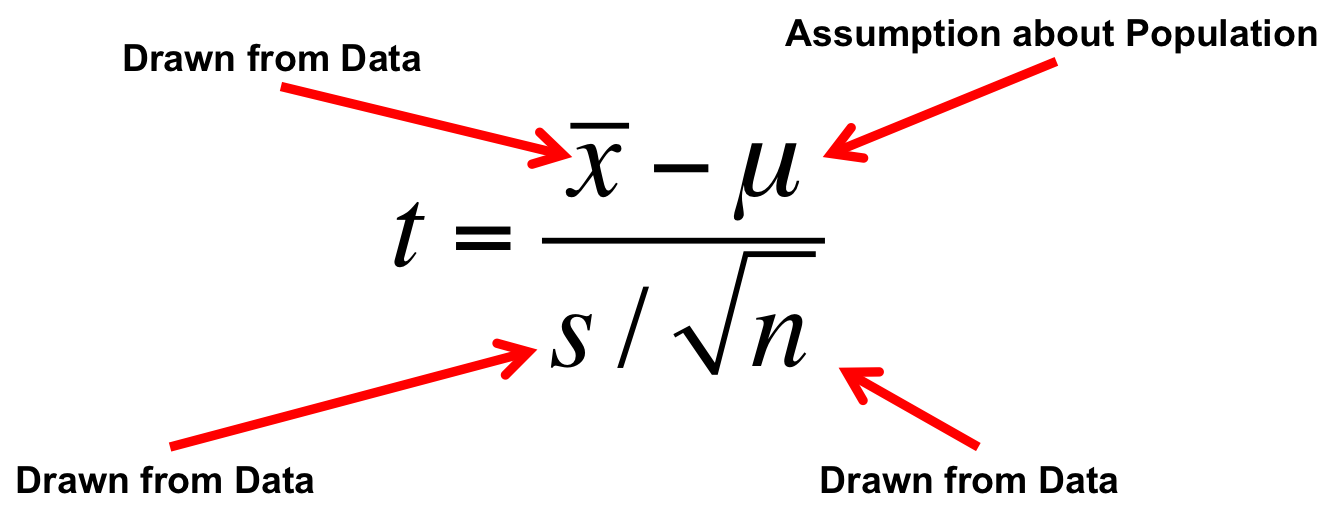
A T-Distributed Golem: A New Model of the World
DF and Distribution Shape
Using our T Statistic
![]()
- To test for difference from 0, we assume \(\mu = 0\)
- But other conditions can be used to look at differences
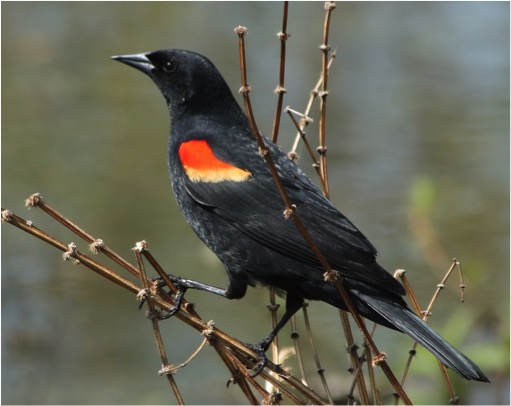
Does bird immunococompetence decrease after a testosterone impant?
Differences in Antibody Performance
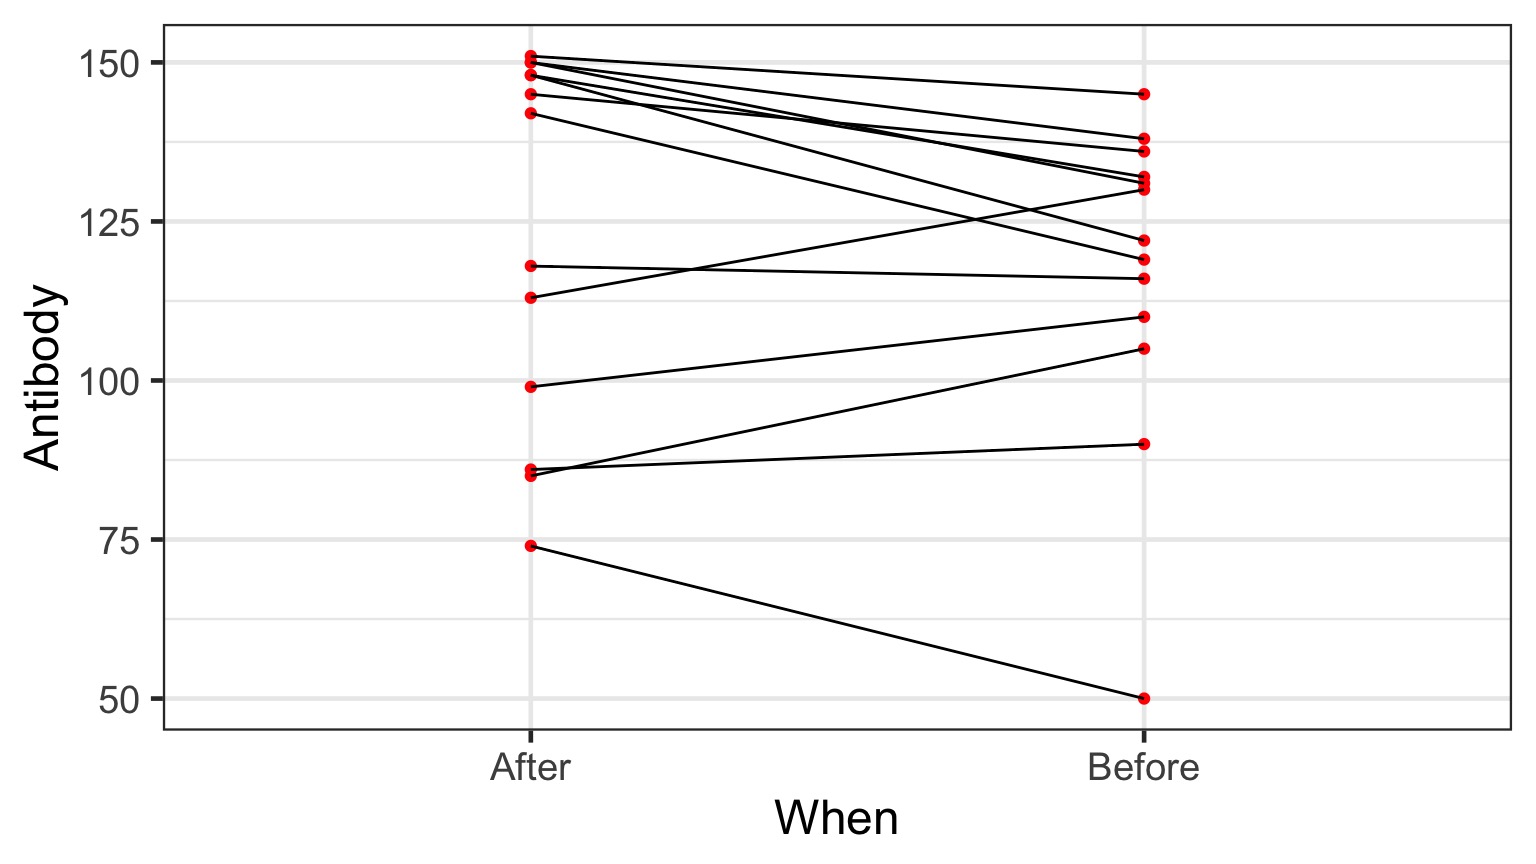
Comparing Paired Groups
\(H_0\): Difference = 0
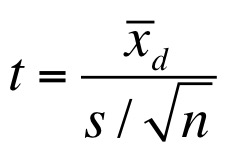
- \(\bar{x_d}\) is the mean difference between paired samples
- Evaluate against T Distribution with n-1 Degrees of Freedom
- n = # of pairs
What’s The Difference?
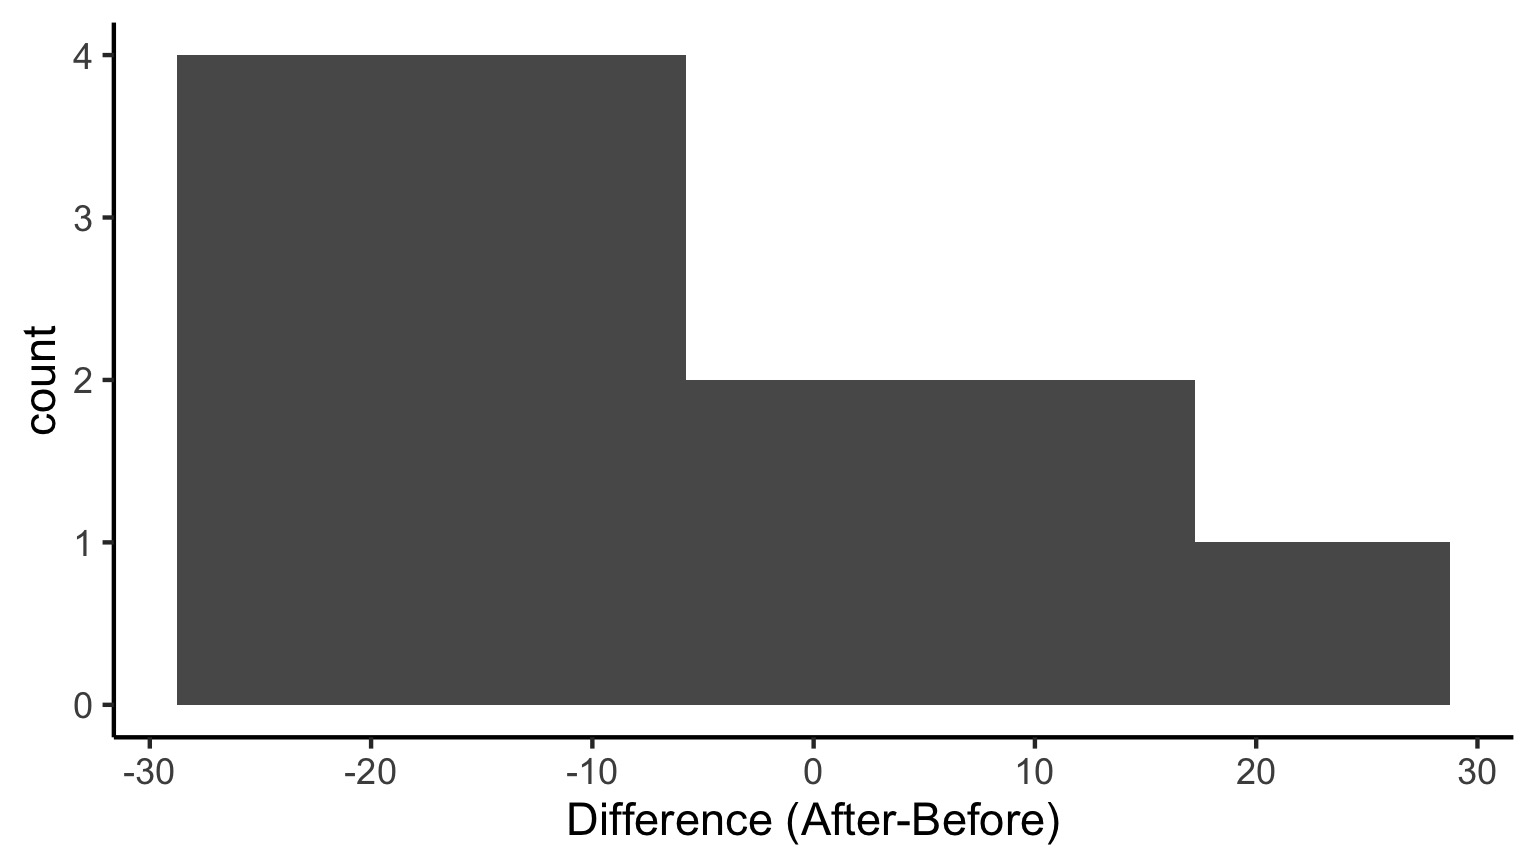
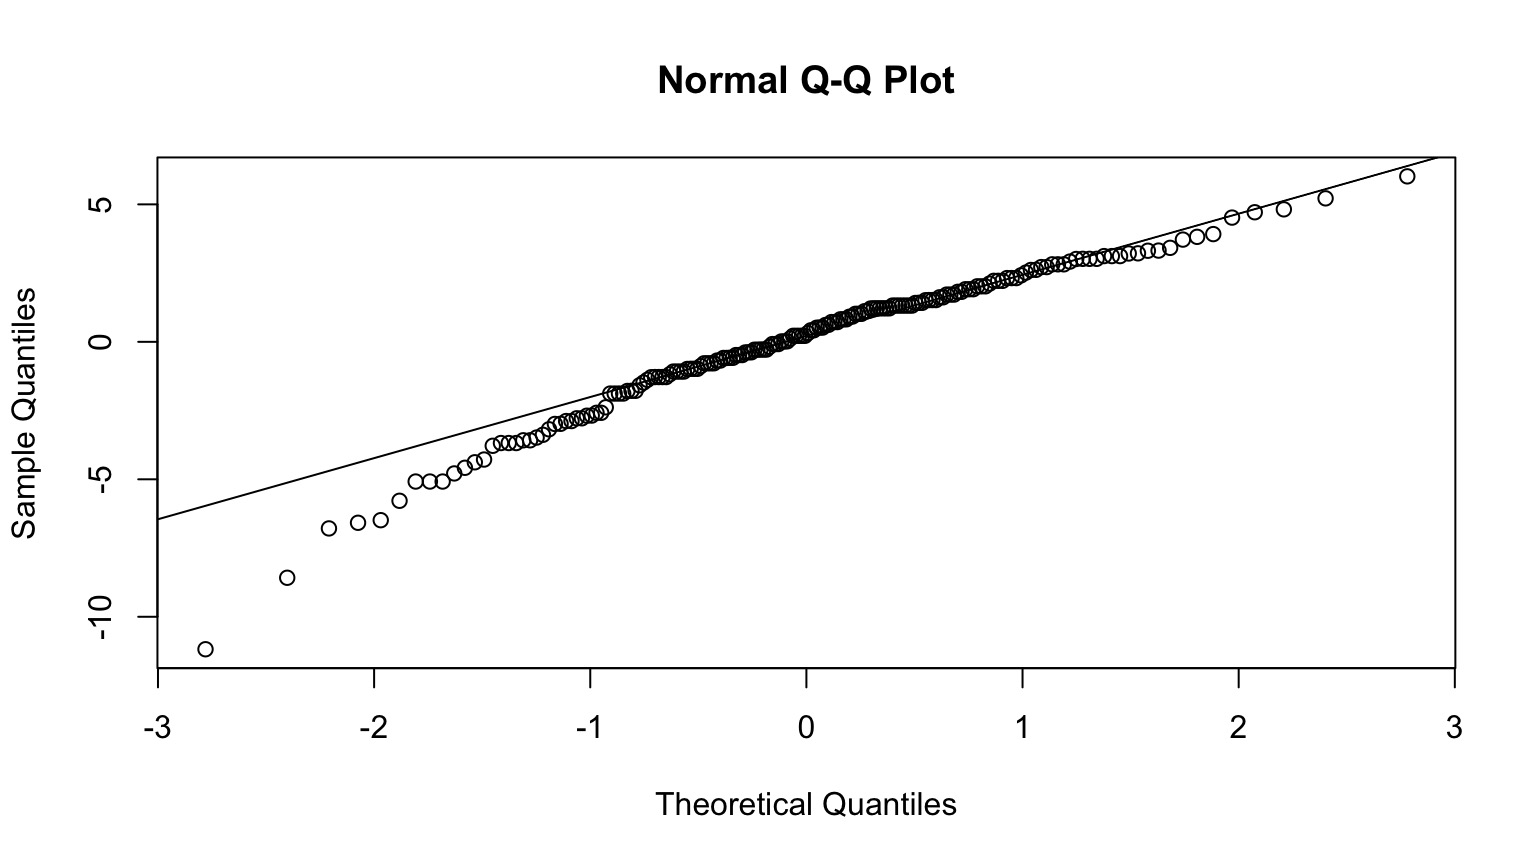
Does this look normal?
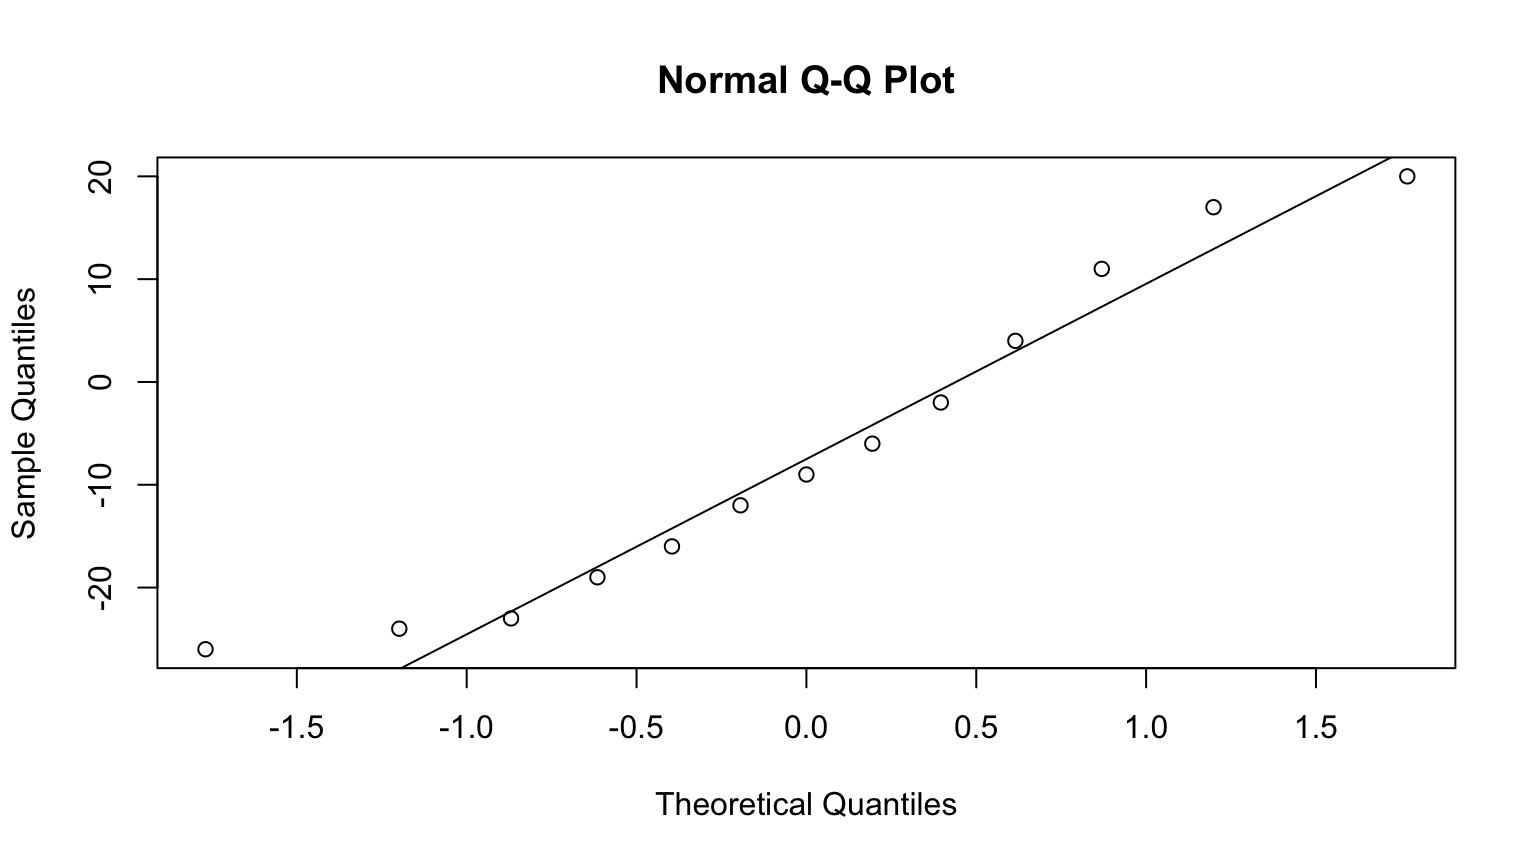
The QQ Plot
What does this mean?
We Can Event Plot the Quantiles of a Normal Distribution
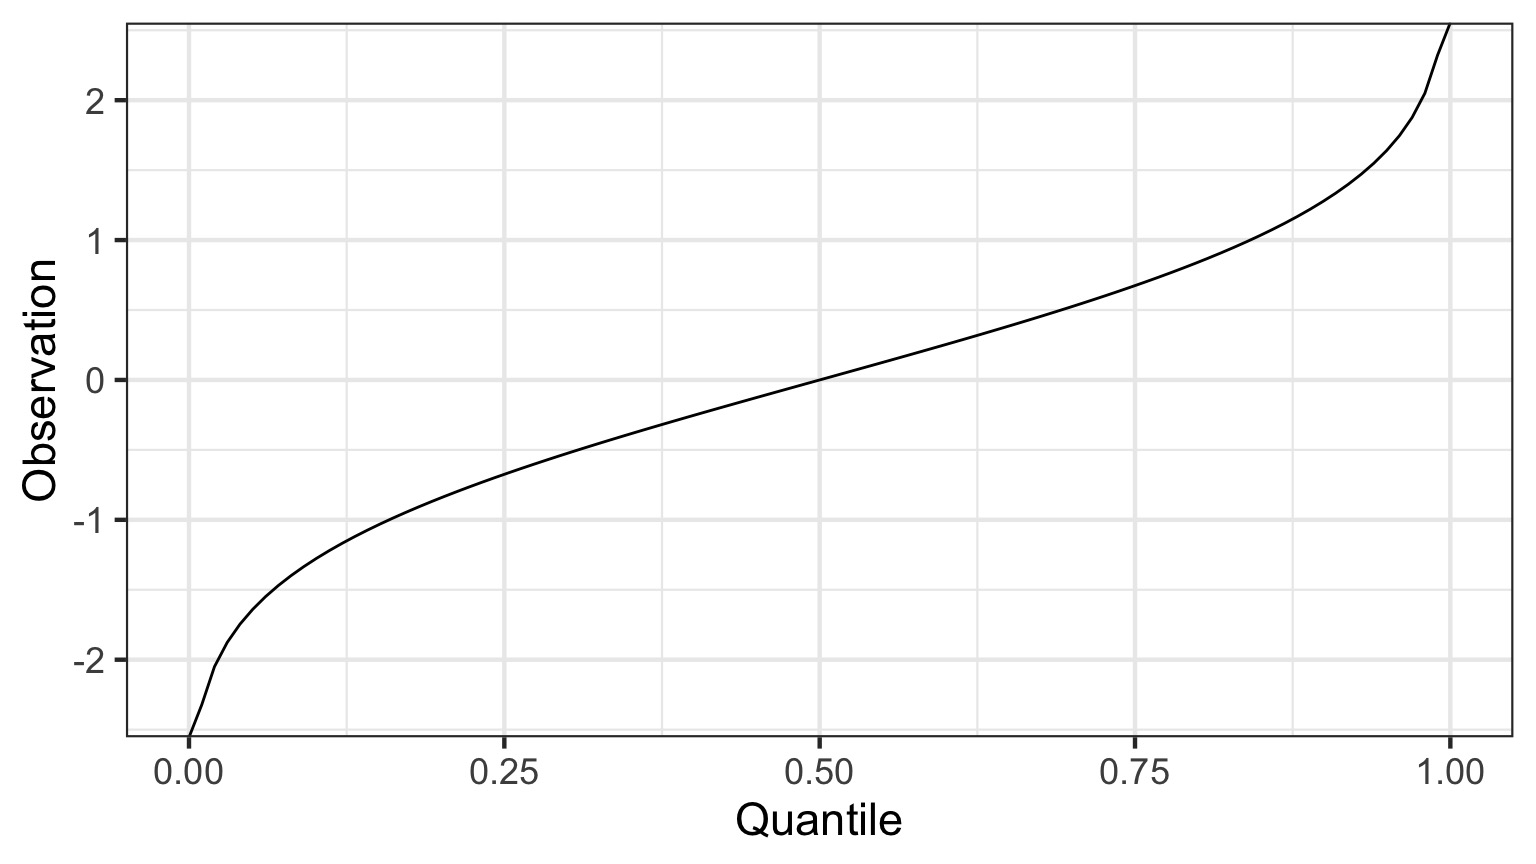
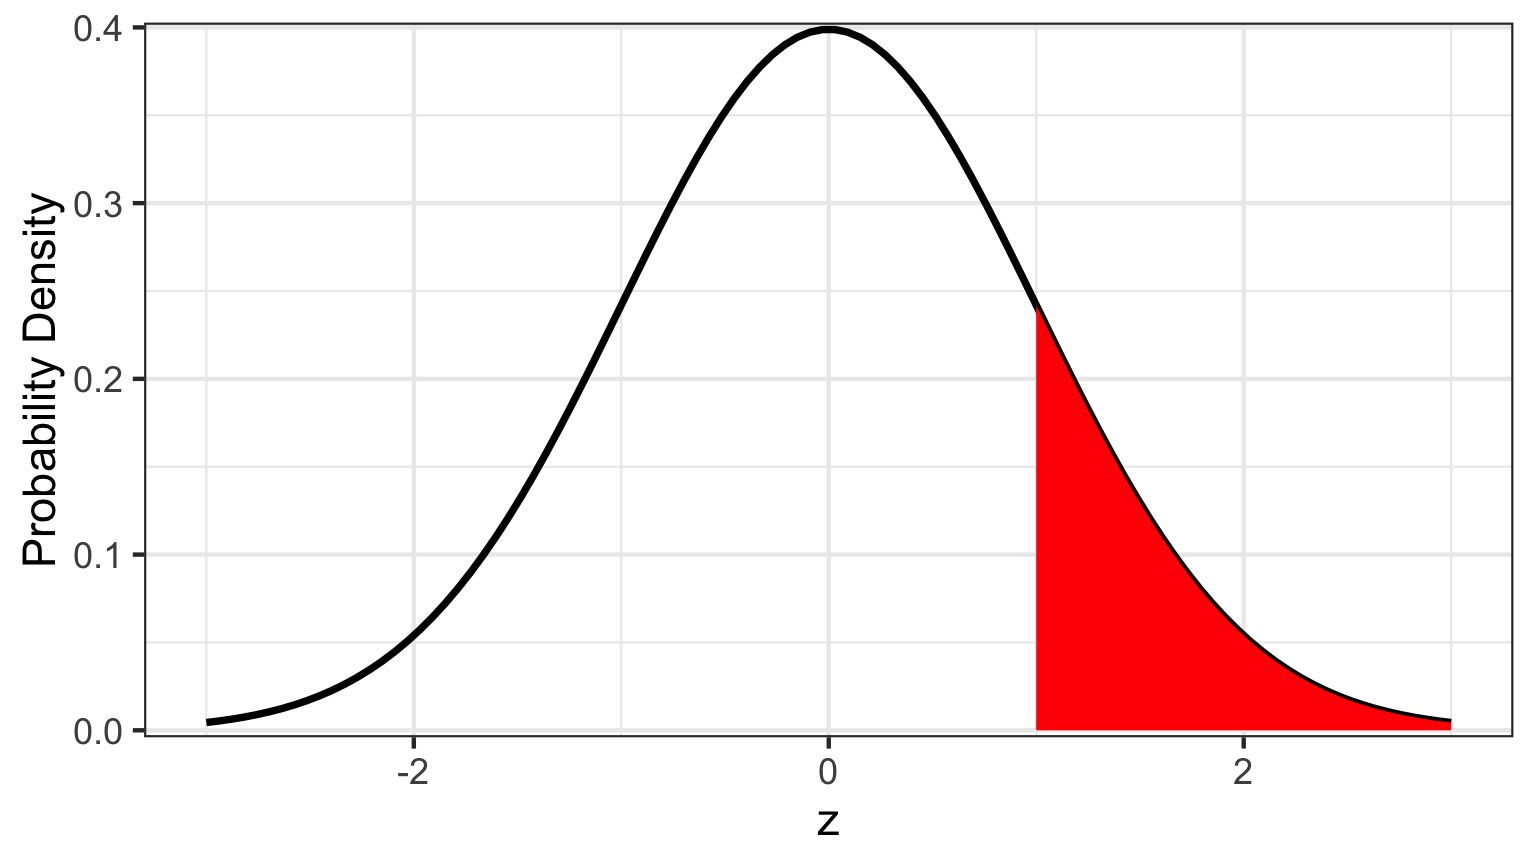
N.B. Quantiles are the 1-tailed P-Value!
Our data has Quantiles
       0% 8.333333% 16.66667%       25% 33.33333% 41.66667%       50%
      -26       -24       -23       -19       -16       -12        -9
58.33333% 66.66667%       75% 83.33333% 91.66667%      100%
-6 -2 4 11 17 20 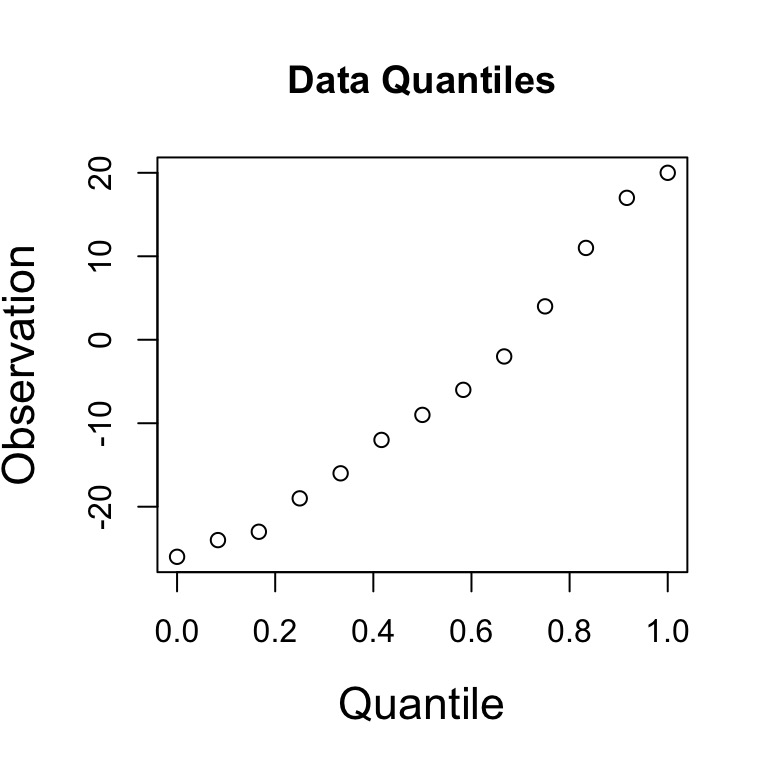
A Normal QQ Plot shows these values plotted against the corresponding quantiles of a Normal Distribtion
The QQ Plot
If these values were normally distibuted, there would be a linear relationship, as the pattern of quantiles would be the same.
Difference on a Log Scale
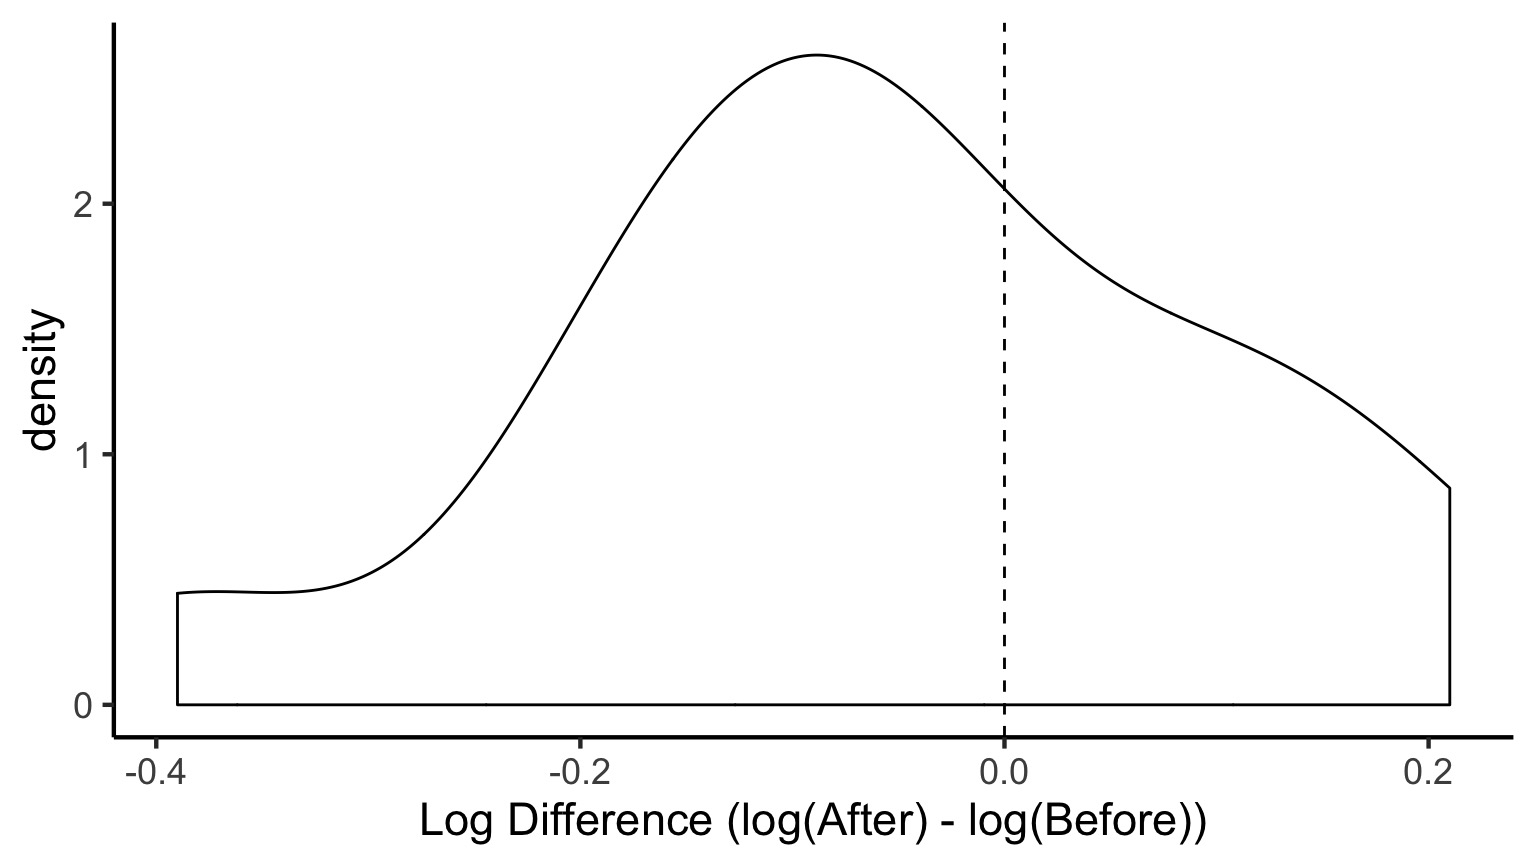
# A tibble: 1 x 6
  estimate statistic p.value parameter method            alternative
     <dbl>     <dbl>   <dbl>     <dbl> <chr>             <chr>
1 -0.0562 -1.27 0.228 12 One Sample t-test two.sided Horned Lizard Survivorship
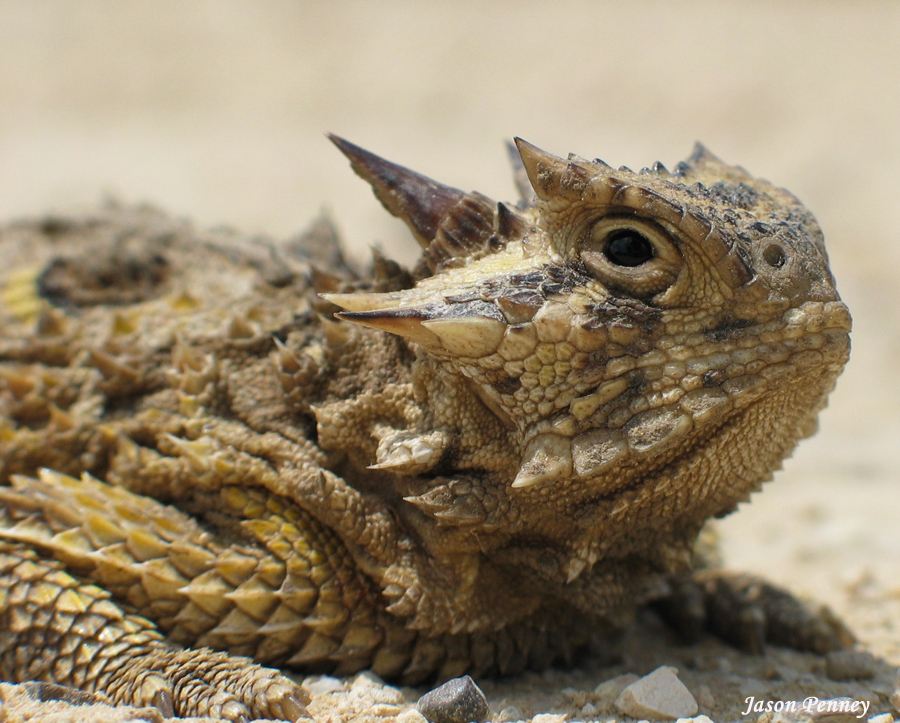
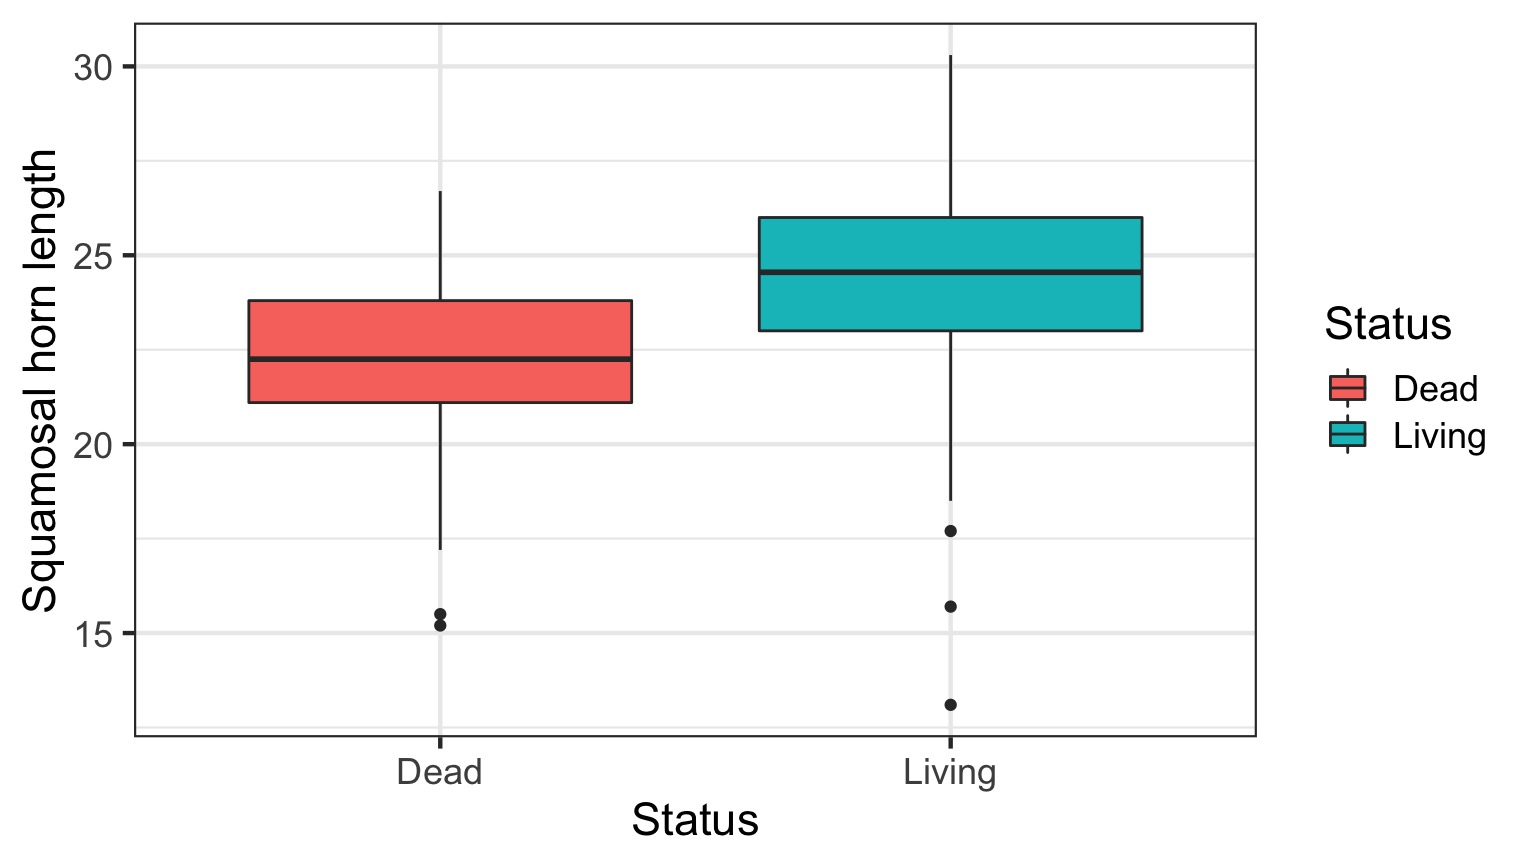
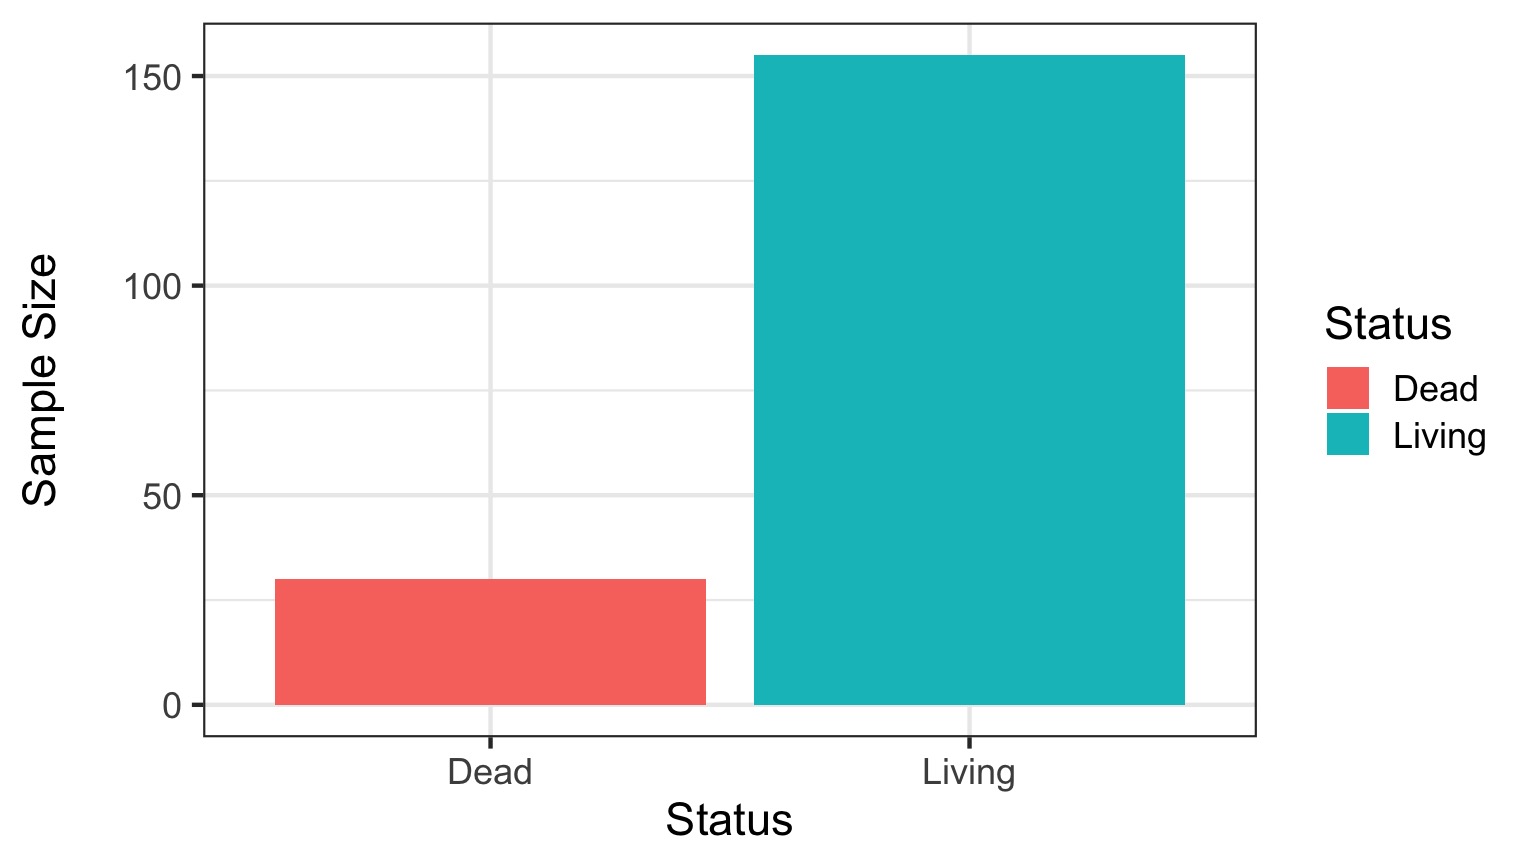
Horns prevent these lizards from being eaten by birds. Are horn lengths different between living and dead lizards?
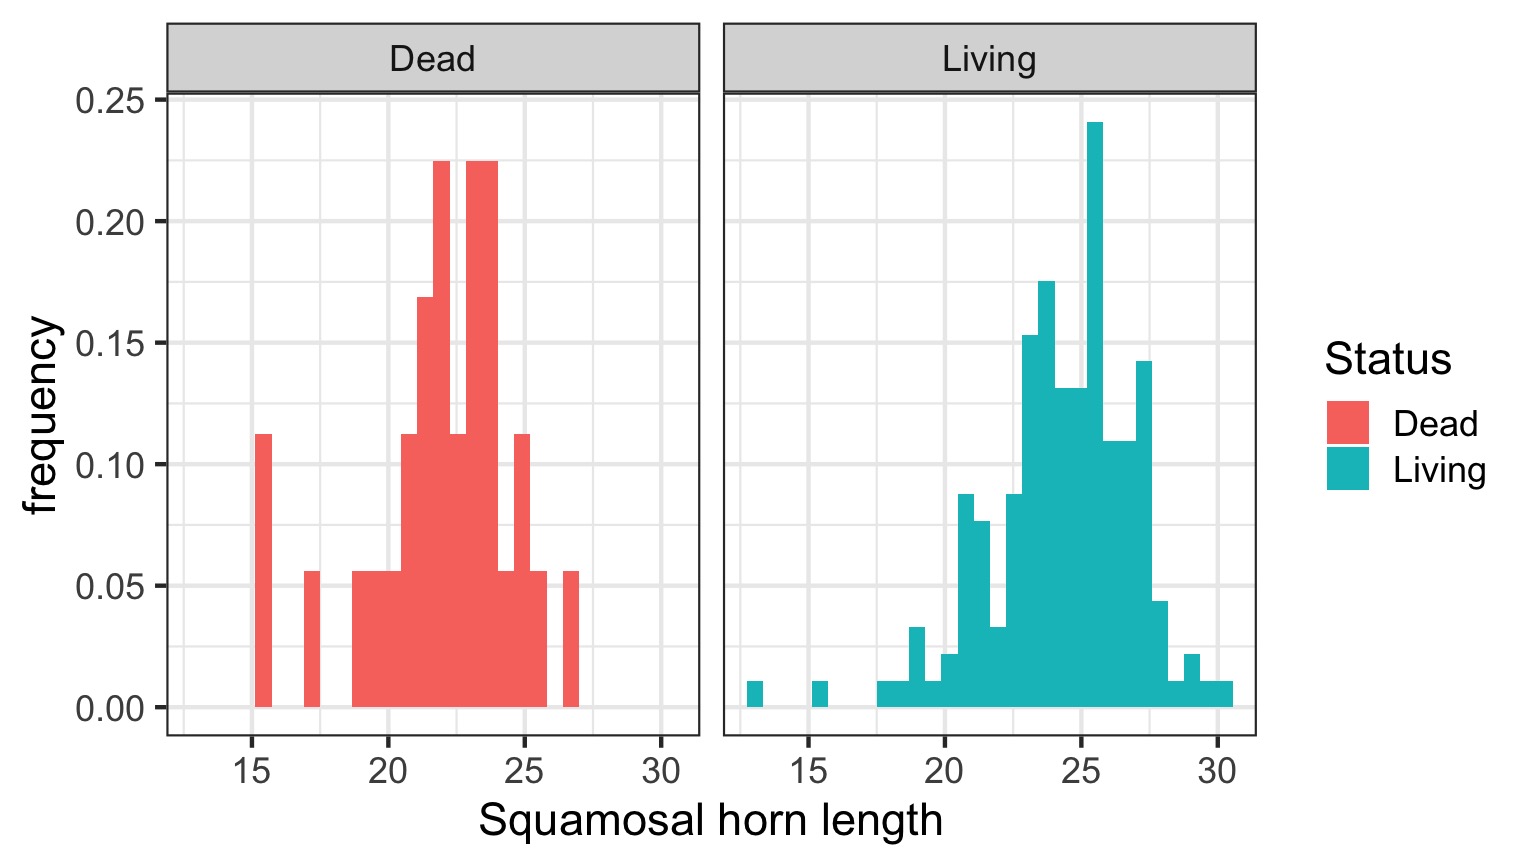
The Data
What is the data generating process?
Evaluating Error Generating Process
Evaluating Residuals for Normality
Unequal Sample Size?
There’s a formula for that!
Visualization
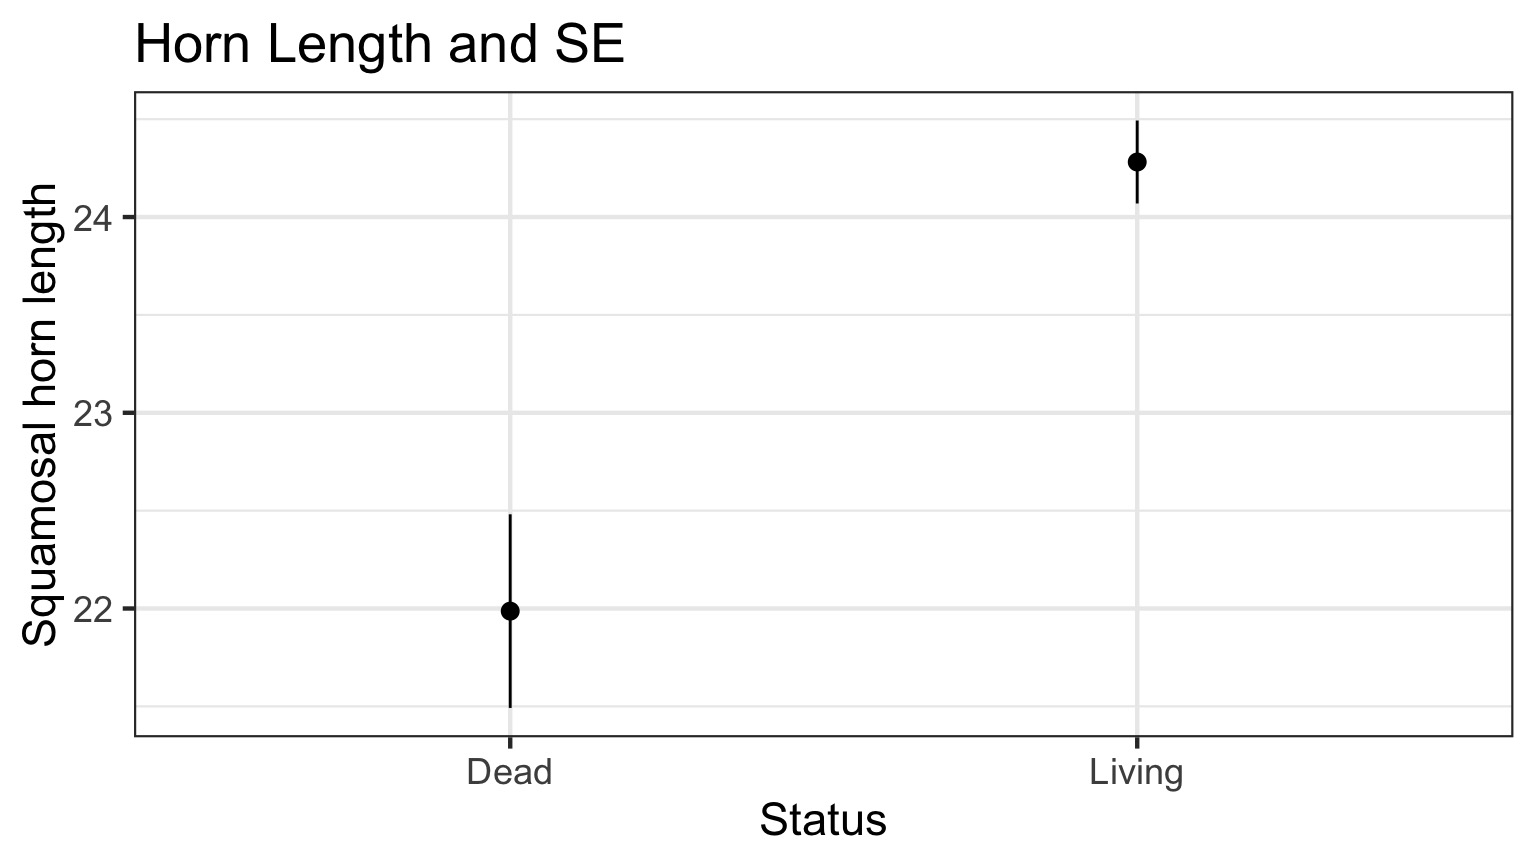
What is being shown here?