Introduction to An Introduction to Computational Data Analysis for Biology
Jarrett Byrnes
UMass Boston
https://biol607.github.io/
![http://libguides.wits.ac.za/content.php?pid=220705&sid=3862732]()

UMass Boston
https://biol607.github.io/
Second, Some Old Technology

- Green: Party on, Wayne
- Red: I fell off the understanding wagon
- Blue: Write a question/Other
Data (maintaince)

Analysis (philosophy)
Analysis (visual)
for Biology
Avoiding The Replication Crisis

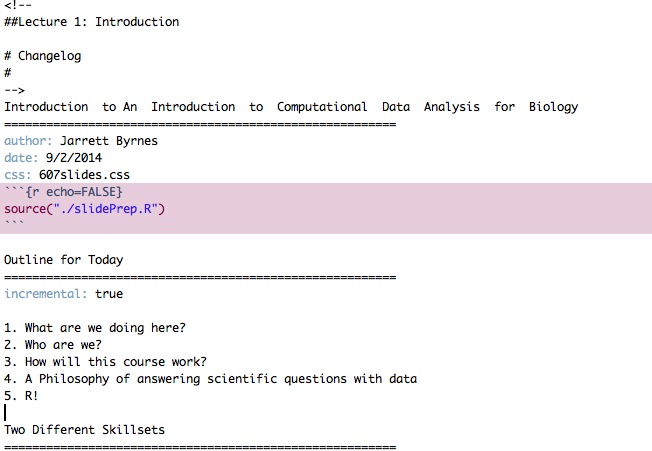
Yes, Lectures are Coded
R Markdown sometimes with Reveal.js
Readings for Class: W&S
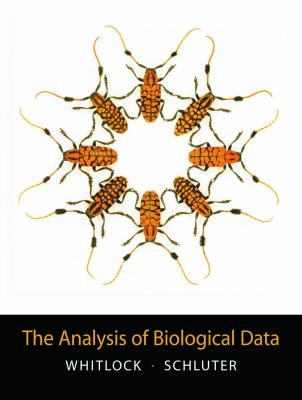
Whitlock, W.C. and Schluter, D. (2014) The Analysis of Biological Data, 2nd Edition.
http://whitlockschluter.zoology.ubc.ca/
Chapter 1 this week!
Readings for Class: Wickham & Grolemund

Grolemund, G., and Wickham, W. 2016. R for Data Science.
http://r4ds.had.co.nz
Extra Credit 1: Use Github

- This whole class is a github repo
- Having a github presence is becoming a real advantage
- So…. create a class repository!
- If you submit a link to your homework in a repo, +1 per homework!
- There will be a github tutorial outside of class hours
Extra Credit 2: Be Nate Silver (before the general election)

Extra Credit 2: Be Nate Silver (before the general election)
- 5 points for getting the correct answer
- 5 extra points for explicitly stating the confidence of your estimates
- 5 points for a clear explanation of the methodology
- 1 point for each thing you do beyond a weighted average of polls
Extra Credit 3: Livin’ La Vida Data Science
 |
 |
Extra Credit 4: Further Data Science at UMB

- +3 for joining the UMBRUG slack group and the Biol607 channel
- +5 for attending Stats Snack on Tuesdays in Science S4-6401
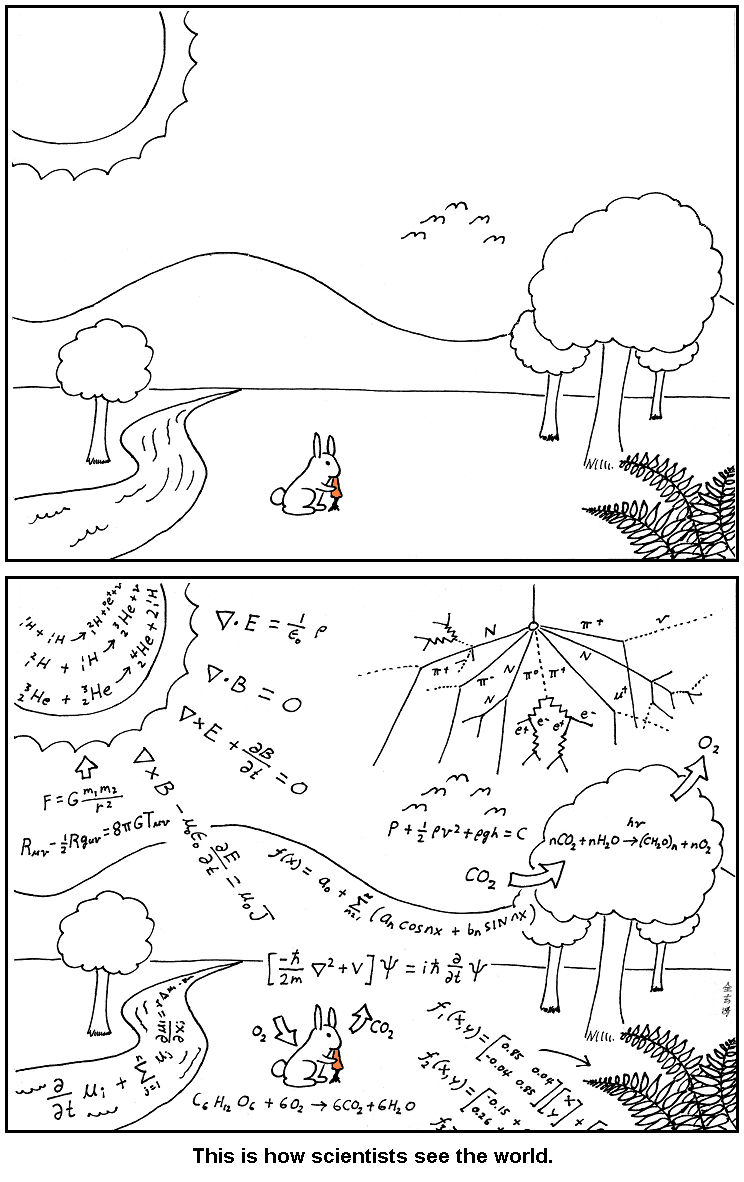
How Biostats is Often Thought of
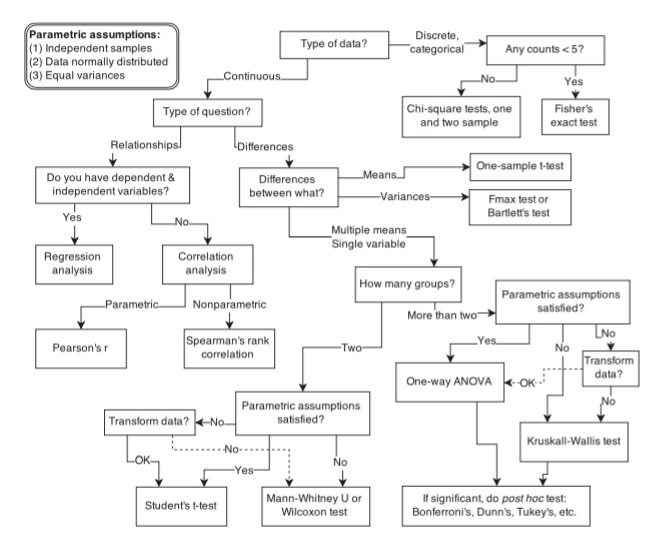
Conceive of a model of your system

How much do you need to know to answer your question?

What data do you need to parameterize your model of the world?

Fit your model of the world

Query your model to answer your question

Start with a Question
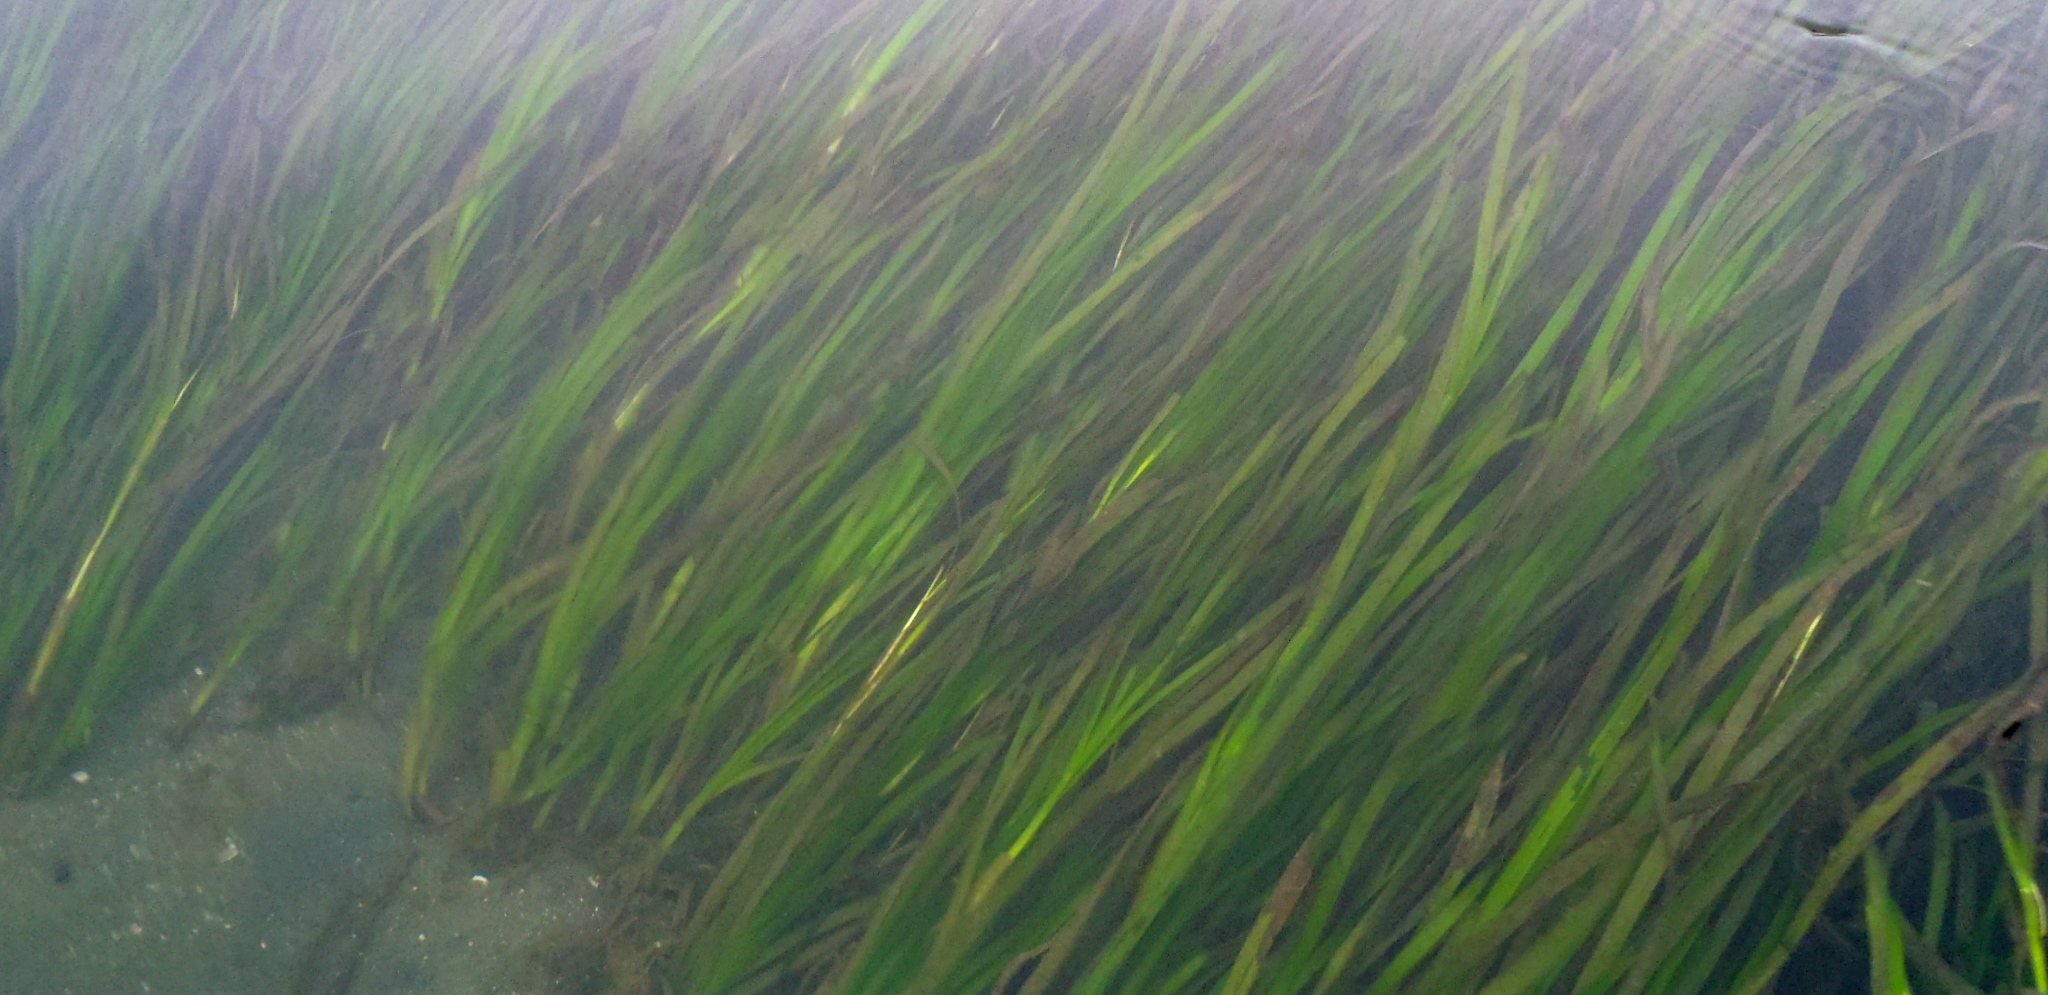
Does seagrass genetic diversity increase productivity?
Conceive of a model of your system
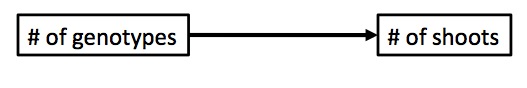
Conceive of a model of your system
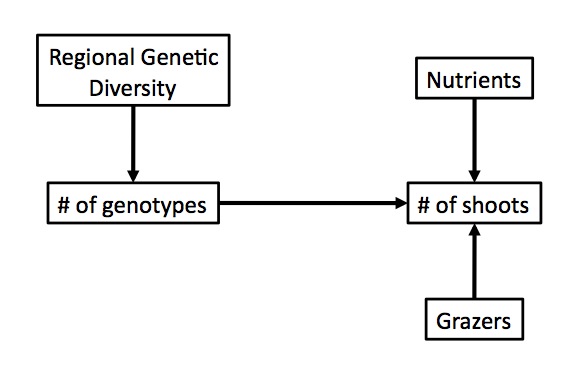
Conceive of a model of your system
How much do you need to know to answer your question?
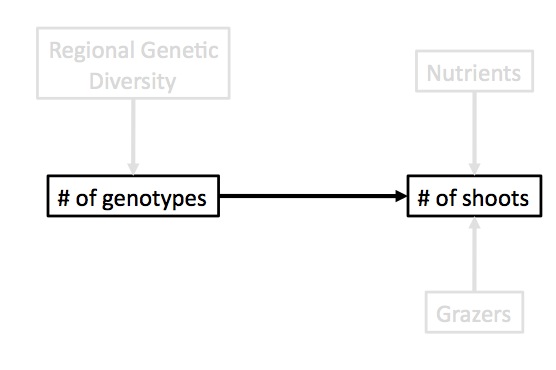
What data do you need to parameterize your model of the world?
1
Genotype
Genotype
3
Genotypes
Genotypes
6
Genotypes
Genotypes
Look at Your Data
Fit a model(s), chosen to suit data & error generating process!
Fit your model of the world & Query It
## `geom_smooth()` using formula 'y ~ x'