class: center, middle background-image: url(images/01/Sonoma_coast.jpg) background-position: center background-size: cover # .large[Introduction to Computational Data Analysis for Biology] ## .center[2023 Edition] ### .center[Jarrett Byrnes] UMass Boston https://biol607.github.io/ --- class: center # Why are we here?  --- # Who are You? 1. Name 2. Lab 3. Brief research description 4. Why are you here? -- .center[Write it here: https://etherpad.wikimedia.org/p/607-intro-2022] --- # Course Goals 1. Learn how to think about your research in a systematic way to design efficient observational & experimental studies. <br><br> -- 2. Understand how to get the most bang for your buck from your data. <br><br> -- 3. Make you effective collaborators with statisticians. <br><br> -- 4. Learn how to program to expand your scientific toolkit. <br><br> -- 5. Make you comfortable enough to learn and grow beyond this class. --- # What are we doing here? ## Course divided into blocks -- 1. Introduction to computation and reproducibility -- 2. Regression and Inference -- 3. Further Adventures in Statistical Modeling -- 3. Causal Inference and Study Design --- # Block 1: Computation ```r # Load the library #### library(ggplot2) # Load the data #### eelgrass <- read.csv("./data/15q05EelgrassGenotypes.csv") # Plot #### ggplot(eelgrass, aes(y = shoots, x = treatment.genotypes)) + geom_point() + stat_smooth(method = "lm") + theme_classic(base_size = 17) + labs(x = "No. of Genotypes", y = "No. of Shoots per sq. m.") ``` -- .center[.large[.red[Coding is power!]]] -- .center[.large[.red[Code Forces You to Be Explicit About Biology]]] --- class:center # Block 1: Reproducibility 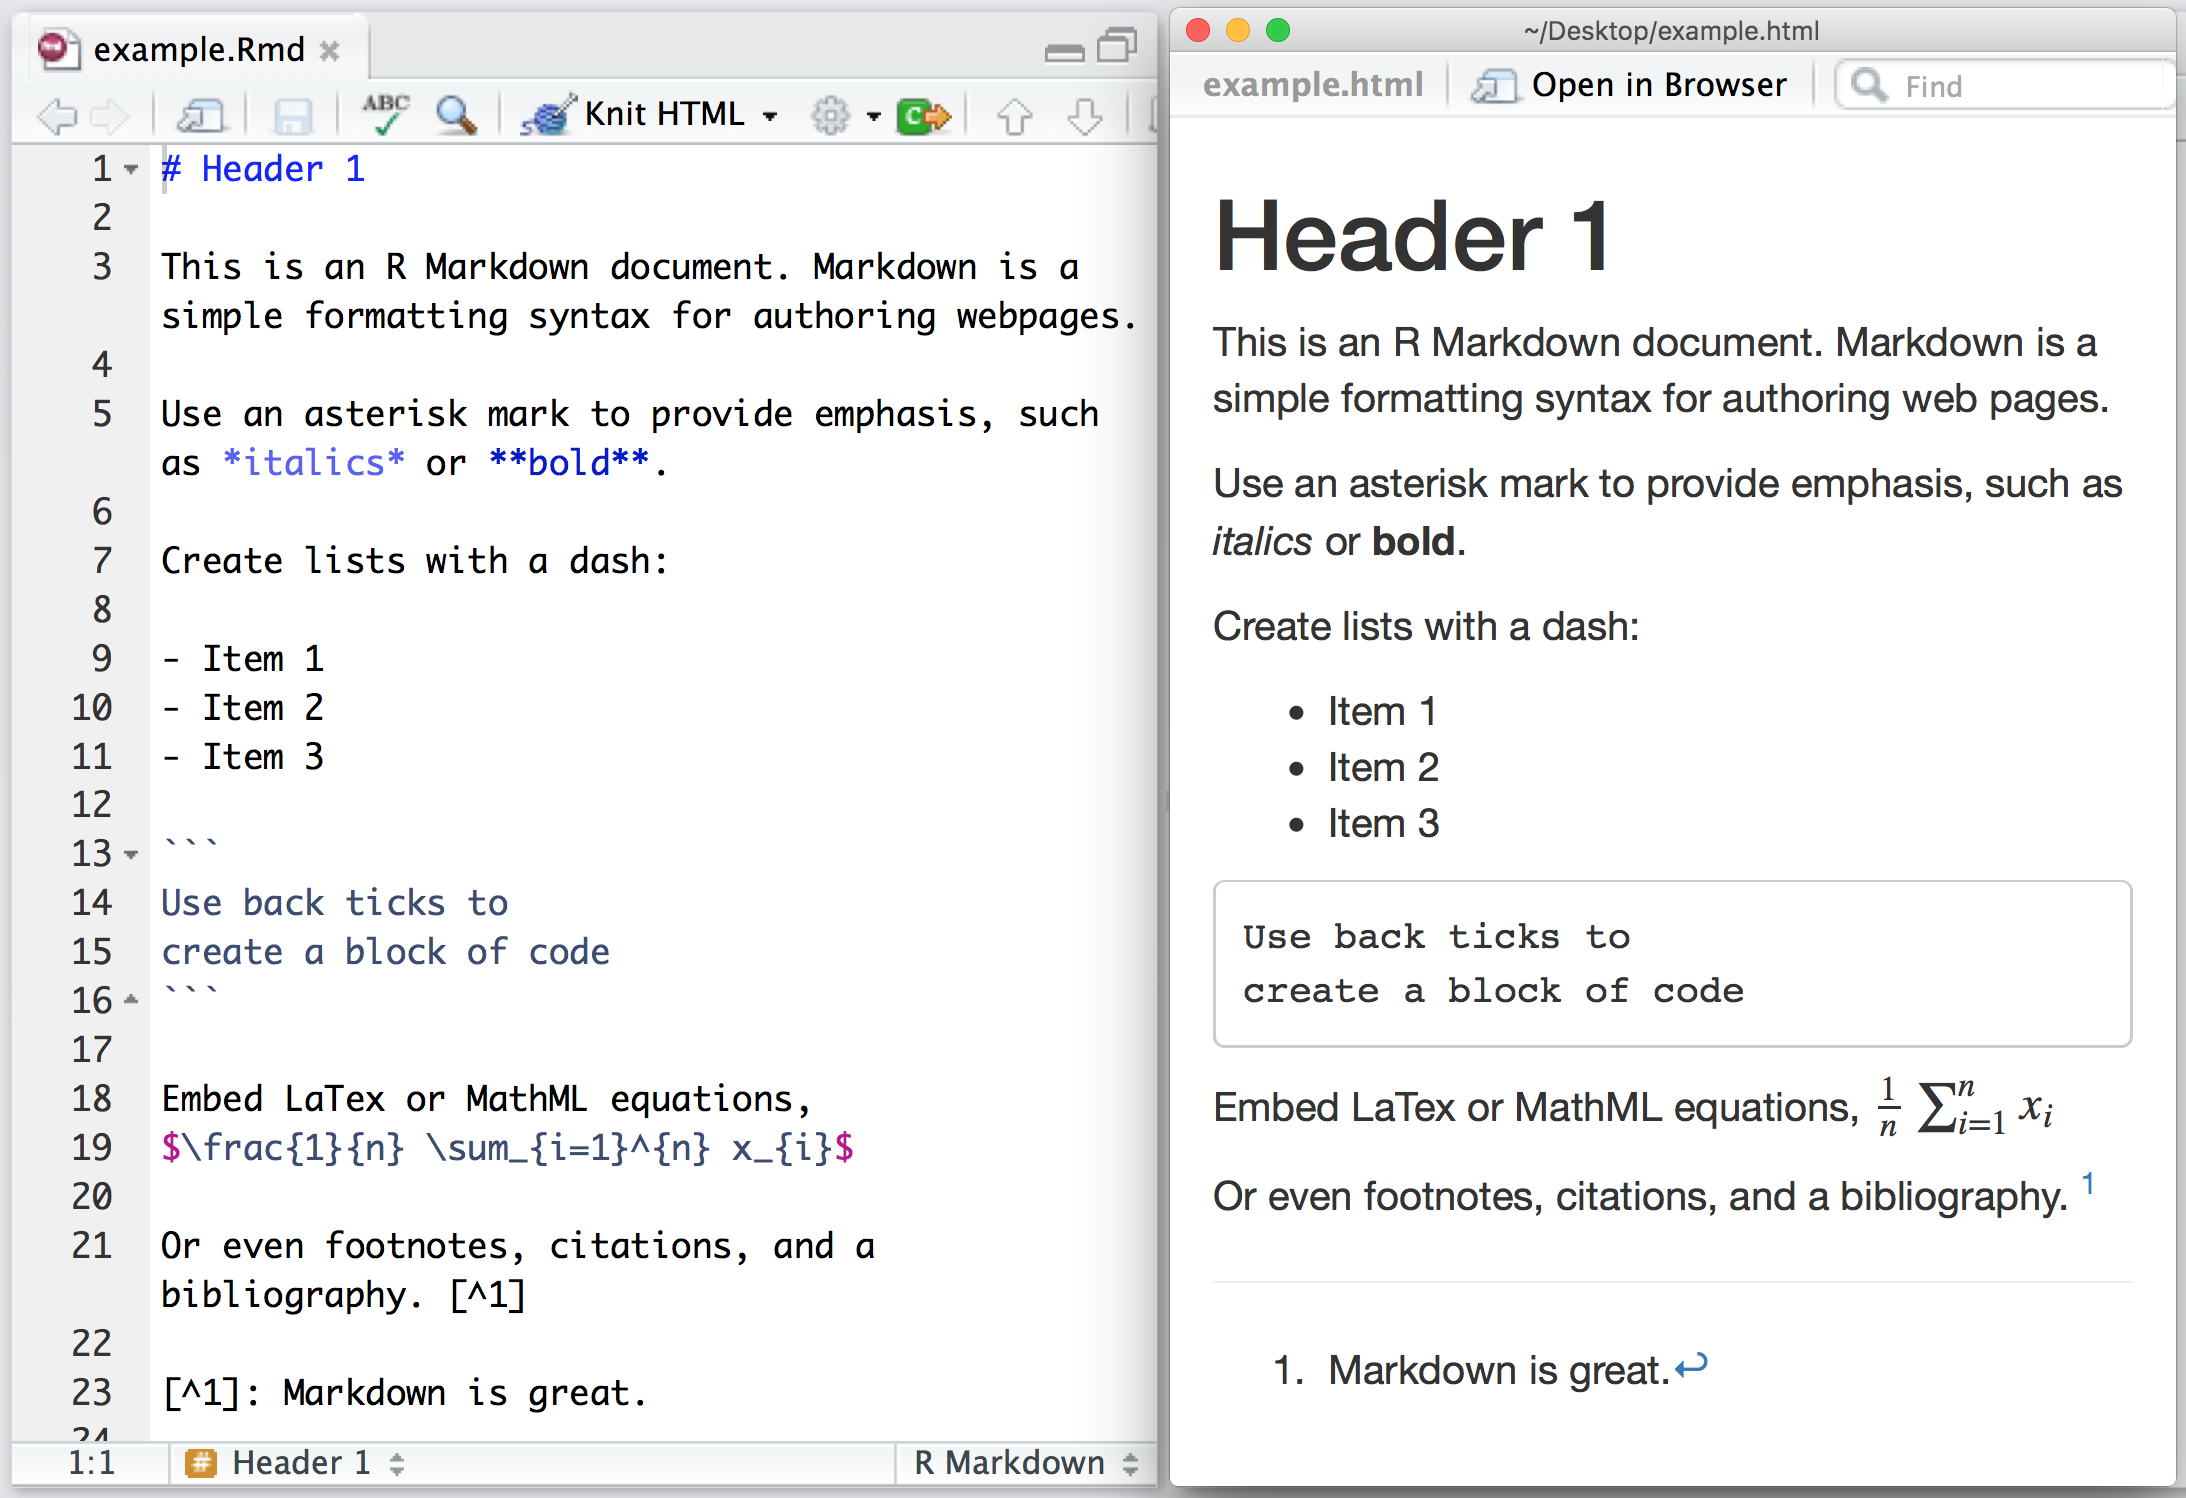 --- class:center # Furthering Open Science 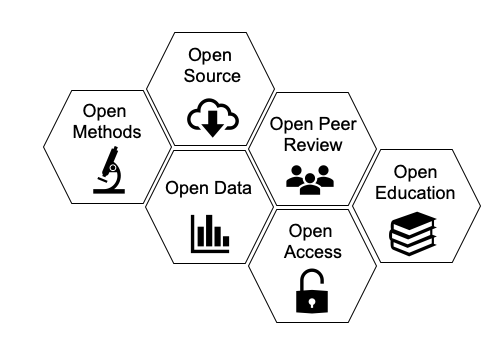 --- # Block 2: Regression 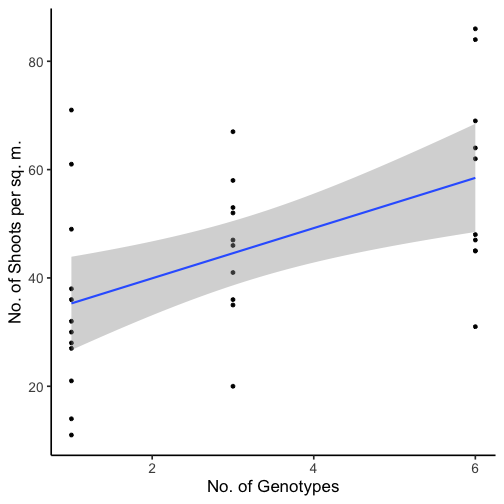<!-- --> --- # Block 3: Further Adventures 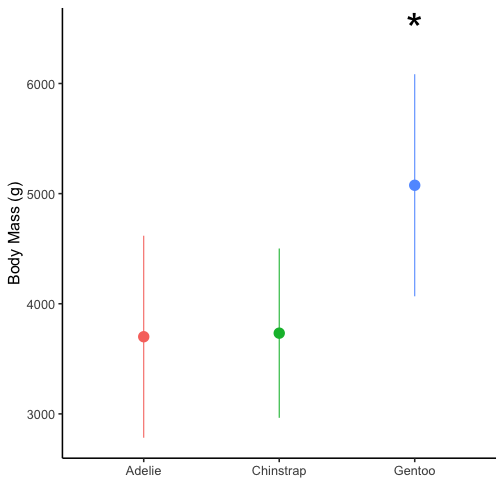<!-- --> -- .large[.center[Don't worry! It's all just a line!]] --- # Block 3: Further Adventures 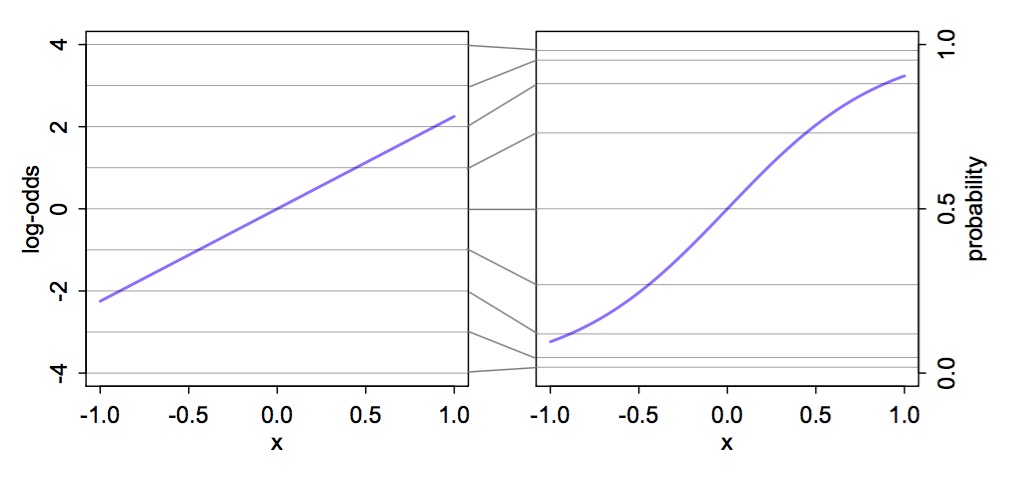 -- .large[.center[Don't worry! It's all just a line!]] --- class:center # Block 4: Causal Inference 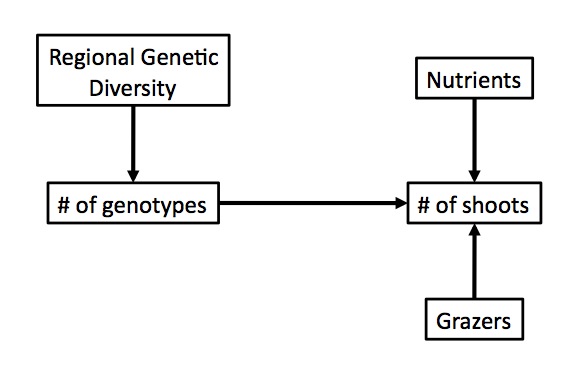 --- # Block 4: Study Design 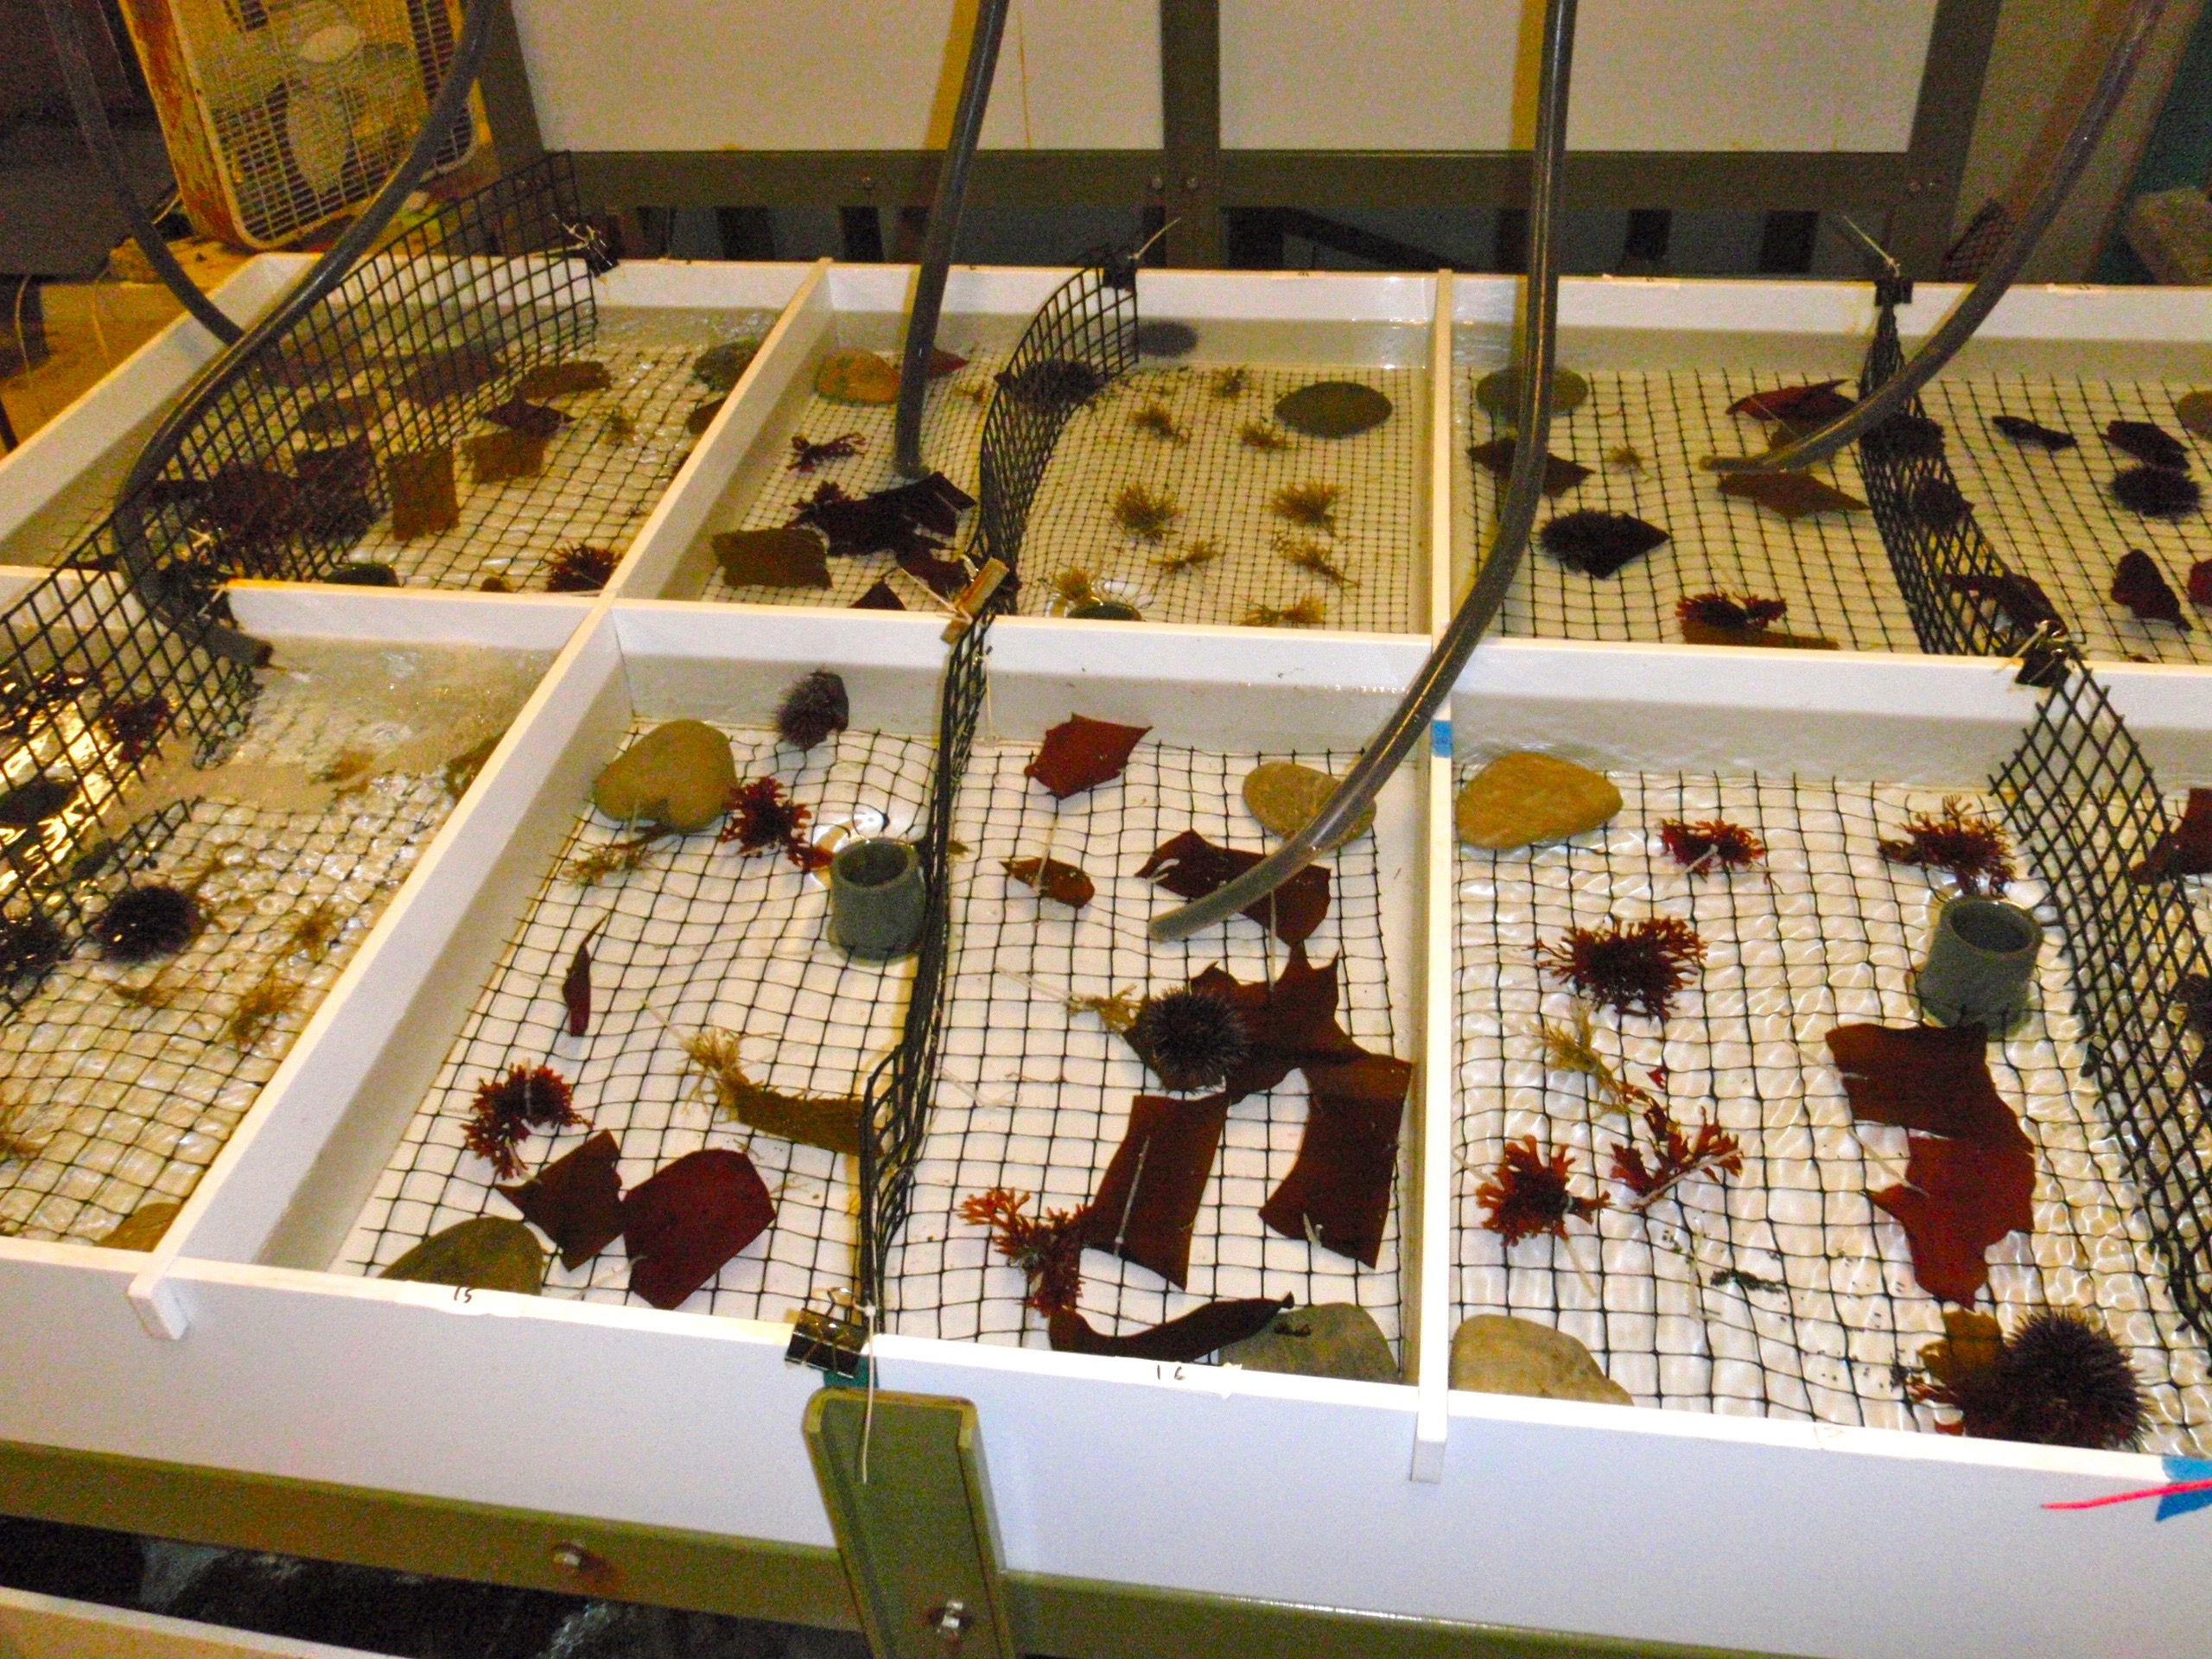 --- # Block 5: Inference .center[] - What is the probability of a hypothesis? Or data given a hypothesis? - Is variation explained by a driver of interest? - How confident are you in your conclusions? - How can we generalize from our models to the world? --- # Lecture and Lab - T/Th Lecture on Concepts - Also Paper Discussion, Shiny Apps, etc. - Please bring your most interactive self! - I will try and make it easy for folk on Zoom - F Lab - Live coding! - I will screw up - don't take me as gospel! - Be generous with feedback/pace comments - Invite your friends! --- # Yes, Lectures are Coded R Markdown sometimes with Reveal.js or Xarnigan .center[<img src="images/01/lecture_code.jpg">] http://github.com/biol607/biol607.github.io --- # Some Old Technology .center[  ] - Green: Party on, Wayne -- - Red: I fell off the understanding wagon -- - Blue: Write a question/Other --- class: center # Readings for Class: Fieberg  .left[Feiberg, J. 2022. Statistics for Ecologists.] ### https://fw8051statistics4ecologists.netlify.app/ --- class: center # Help John Out! Annotate His Book!  ## https://hypothes.is/signup --- class: center # Readings for Class:<br>Wickham & Grolemund  .left[Wickham, H. Çetinkaya-Rundel, M. and Grolemund, G., 2023. R for Data Science.] https://r4ds.hadley.nz/ --- class:center # There will be memes  -- .large[please feed my #statsmeme addiction] --- # And Now, A Pop Quiz! (I kid! I kid!) <br><br><center> <div style="font-size: 2em;font-weight: bold;">http://tinyurl.com/firstPopQuiz</div> </center><br><br> --- # My Actual Policy on Grading .center[  ] --- # Problem Sets - THE MOST IMPORTANT THING YOU DO - Adapted from many sources - Will often require R - Complete them using Quarto/Rmarkdown - Submit via Dropbox or Github --- # Midterm - Advanced problem set - After Regression. Probably. --- # Final Project - Topic of your choosing - Your data, public data, any data! - Make it dissertation relevant! - If part of submitted manuscript, I will retroactively raise your grade - Dates - Proposal Due Oct 20th - Presentations on Dec 15th - Paper due Dec 20th (but earlier fine!) --- # Impress Yourself: Use Github .center[] - This whole class is a github repo - Having a github presence is becoming a real advantage - So.... create a class repository! - folder for homework, folder for exams, folder for labs - If you submit a link to your homework in a repo, +1 per homework! - There will be a github tutorial outside of class hours? --- # Life La Vida Data Science - Check out http://www.r-bloggers.com/ and https://rweekly.org/ - Listen to podcasts like https://itunes.apple.com/us/podcast/not-so-standard-deviations/ - Start going to local R User Groups like https://www.meetup.com/Boston-useR/ - Follow data science greats on Twitter (see https://twitter.com/jebyrnes/lists/stats-r-on-twitter) - Bring up cool things in the UMBRug slack --- # Help your fellow students  - Having a problem during homework/exam/etc? - First, try and solve it yourself (google, stackoverflow, etc.) - Post a REPRODUCIBLE EXAMPLE to our slack channel - I notice if you post before I do! --- # Become Part of the Conversation Stats and R on Twitter: https://bit.ly/stats_r_twitter. Stats and R on Bluesky: https://bit.ly/bsky_rstats .center[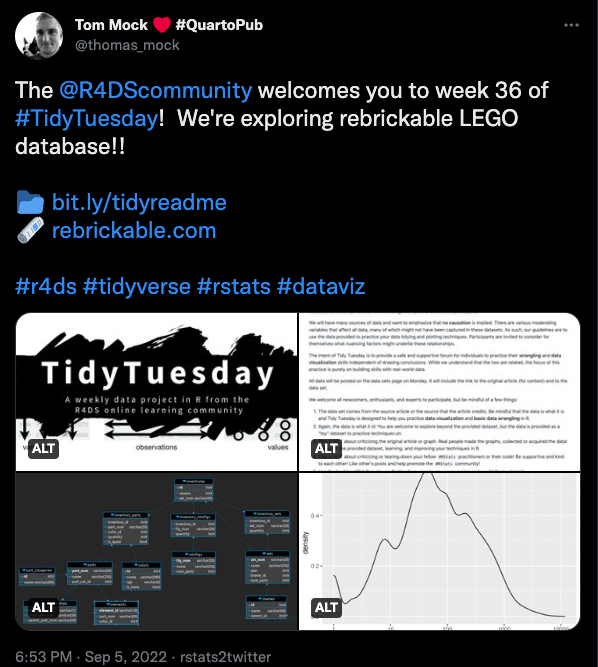] --- # Welcome! <br><br> .center[.middle[]]