class: center, middle # It's All Linear Models: T-Test Edition  --- class: center, middle # Etherpad <br><br> <center><h3>https://etherpad.wikimedia.org/p/607-linear_everywhere-2020</h3></center> --- # YES, YOU KNOW EVERYTHING 1. Beastiary of Everything As a Linear Model 2. T-Tests as a Linear Model --- # Up until now, we've done this `$$y_i = \beta_0 + \beta_1 x_i + \epsilon_i$$` `$$\epsilon_i \sim N(0, \sigma)$$` <img src="t_as_lm_files/figure-html/pp-1.png" style="display: block; margin: auto;" /> --- # But we have wider classes of problems... ### Comparing Two Means <img src="t_as_lm_files/figure-html/unnamed-chunk-1-1.png" style="display: block; margin: auto;" /> -- `$$mass_i = \beta_0 + \beta_1 sex_i + \epsilon_i$$` --- # But we have wider classes of problems... ### Comparing Many Means <img src="t_as_lm_files/figure-html/unnamed-chunk-2-1.png" style="display: block; margin: auto;" /> -- `$$mass_i = \beta_1 adelie_i + \beta_2 chinstrap_i + \beta_3 gentoo_i + \epsilon_i$$` --- # But we have wider classes of problems... ### Many Predictors <img src="t_as_lm_files/figure-html/unnamed-chunk-3-1.png" style="display: block; margin: auto;" /> -- $$length_i = \beta_0 + \beta_1 flipper_i + \beta_2 depth_i+ \epsilon_i $$ --- # But we have wider classes of problems... ### One Predictor Modifies Another <img src="t_as_lm_files/figure-html/unnamed-chunk-4-1.png" style="display: block; margin: auto;" /> -- `$$\small flipper_i = \beta_0 mass_i + \beta_1 adelie_i + \beta_2 chinstrap_i + \beta_3 gentoo_i +$$` $$\small\beta_4 mass_iadelie_i + \beta_5 mass_ichinstrap_i + \beta_6 mass_igentoo_i + \epsilon_i $$ --- class:center, middle  --- # But we have wider classes of problems... ### Nonlinear Models and Transformation <img src="t_as_lm_files/figure-html/metabolism-1.png" style="display: block; margin: auto;" /> -- `$$log(bmr_i) = log(\beta_0) + \beta_1 log(mass_i) + \epsilon_i$$` `$$bmr_i = \beta_0 mass_i^{\beta_1} \epsilon_i$$` --- # But we have wider classes of problems... ### Non-Normal Nonlinear Models <img src="t_as_lm_files/figure-html/crypto_data-1.png" style="display: block; margin: auto;" /> -- `$$infected_i \sim B(prob.\ infected_i, size = trials)$$` `$$logit(prob.\ infected_i) = \beta_0 + \beta_1 Dose_i$$` --- # But we have wider classes of problems... ### Goodness of Fit .pull-left[ <table class="table table-striped" style="margin-left: auto; margin-right: auto;"> <thead> <tr> <th style="text-align:left;"> Day of the Week </th> <th style="text-align:right;"> Births </th> </tr> </thead> <tbody> <tr> <td style="text-align:left;"> Sunday </td> <td style="text-align:right;"> 33 </td> </tr> <tr> <td style="text-align:left;"> Monday </td> <td style="text-align:right;"> 41 </td> </tr> <tr> <td style="text-align:left;"> Tuesday </td> <td style="text-align:right;"> 63 </td> </tr> <tr> <td style="text-align:left;"> Wednesday </td> <td style="text-align:right;"> 63 </td> </tr> <tr> <td style="text-align:left;"> Thursday </td> <td style="text-align:right;"> 47 </td> </tr> <tr> <td style="text-align:left;"> Friday </td> <td style="text-align:right;"> 56 </td> </tr> <tr> <td style="text-align:left;"> Saturday </td> <td style="text-align:right;"> 47 </td> </tr> </tbody> </table> ] .pull-right[ <img src="t_as_lm_files/figure-html/unnamed-chunk-6-1.png" style="display: block; margin: auto;" /> ] -- `$$births_i \sim P(\widehat{births_i})$$` `$$log(\widehat{births_i}) = \beta_1Monday_i + \beta_2Tuesday_i+...$$` --- # But we have wider classes of problems... ### Contingency Tables .pull-left[  ] .pull-right[ <img src="t_as_lm_files/figure-html/unnamed-chunk-7-1.png" style="display: block; margin: auto;" /> ] -- `$$count_i \sim P(\widehat{count_i})$$` `$$log(\widehat{count_i}) = \beta_1eaten_i + \beta_2infection_i+ \beta_3 eaten_i *infection_i$$` --- # IT'S ALL VARIANTS OF A (GENERALIZED) LINEAR MODEL `$$\large f(\widehat{y_i}) = \beta_0 + \beta_1 x1_i + \beta_2 x2_i + \ldots$$` <br> `$$\large y_i \sim Dist(mean = \widehat{y_i}, dispersion = s(\widehat{y_i}))$$` - X can be continuous OR discrete (turned into 1 and 0) - Y can be continous, ranks, etc. - f(Y) can be an identity, log, logit, or other relationship - Dist can be normal, or really anything - s(Y) can be just a single number, a linear, or nonlinear function --- class:center, middle  --- # YES, YOU KNOW EVERYTHING 1. Beastiary of Everything As a Linear Model 2. .red[T-Tests as a Linear Model] --- # Classical Approach: T-test  --- # Classical Approach: T-test  --- # The One-Sample T-Test - We take some data - We estimate it's mean and SE - We calculate whether it is different from some hypothesis (usually 0) -- - But.... isn't this just an intercept only model? `$$\Large y_i = \beta_0 + \epsilon_i$$` --- # Consider Climate-Change Driven Range Shifts - Is the distribution of range-shifts 0? <img src="t_as_lm_files/figure-html/unnamed-chunk-8-1.png" style="display: block; margin: auto;" /> .small[Chen, I-C., J. K. Hill, R. Ohlemüller, D. B. Roy, and C,. D. Thomas. 2011. Science 333:1024-1026.] --- # Testing a Mean with an Intercept Only Model ```r shift_mod <- lm(elevationalRangeShift ~ 1, data = shift) shift_t <- t.test(shift$elevationalRangeShift) ``` LM Coefficients versus T-Test <table class="table" style="margin-left: auto; margin-right: auto;"> <thead> <tr> <th style="text-align:left;"> term </th> <th style="text-align:right;"> estimate </th> <th style="text-align:right;"> std.error </th> <th style="text-align:right;"> statistic </th> <th style="text-align:right;"> p.value </th> </tr> </thead> <tbody> <tr> <td style="text-align:left;"> (Intercept) </td> <td style="text-align:right;"> 39.32903 </td> <td style="text-align:right;"> 5.507258 </td> <td style="text-align:right;"> 7.141309 </td> <td style="text-align:right;"> 1e-07 </td> </tr> </tbody> </table> <table class="table" style="margin-left: auto; margin-right: auto;"> <thead> <tr> <th style="text-align:right;"> estimate </th> <th style="text-align:right;"> statistic </th> <th style="text-align:right;"> p.value </th> </tr> </thead> <tbody> <tr> <td style="text-align:right;"> 39.32903 </td> <td style="text-align:right;"> 7.141309 </td> <td style="text-align:right;"> 1e-07 </td> </tr> </tbody> </table> --- # What if we are looking at Change Between Pairs - Classically, we have the **Paired T-Test** - We look at differences between pairs - Could be One Individual over time - Could be two plots next to each other - Deliciously simple - This is just an intercept only model where the Difference is our response variable `$$\Large (y1 - y2)_i = \beta_0 + \epsilon_i$$` --- # Does bird immunococompetence decrease after a testosterone implant? .center[  ] --- # Differences in Antibody Performance <img src="t_as_lm_files/figure-html/blackbird_plot-1.png" style="display: block; margin: auto;" /> --- # Again, Intercept Only Model v. T-Test LM Coefficients versus T-Test <table class="table" style="margin-left: auto; margin-right: auto;"> <thead> <tr> <th style="text-align:left;"> term </th> <th style="text-align:right;"> estimate </th> <th style="text-align:right;"> std.error </th> <th style="text-align:right;"> statistic </th> <th style="text-align:right;"> p.value </th> </tr> </thead> <tbody> <tr> <td style="text-align:left;"> (Intercept) </td> <td style="text-align:right;"> 6.538462 </td> <td style="text-align:right;"> 4.336215 </td> <td style="text-align:right;"> 1.507873 </td> <td style="text-align:right;"> 0.157455 </td> </tr> </tbody> </table> <table class="table" style="margin-left: auto; margin-right: auto;"> <thead> <tr> <th style="text-align:right;"> estimate </th> <th style="text-align:right;"> statistic </th> <th style="text-align:right;"> p.value </th> </tr> </thead> <tbody> <tr> <td style="text-align:right;"> 6.538462 </td> <td style="text-align:right;"> 1.507873 </td> <td style="text-align:right;"> 0.157455 </td> </tr> </tbody> </table> --- # Consider Comparing Two Means #### Consider the Horned Lizard .center[  ] Horns prevent these lizards from being eaten by birds. Are horn lengths different between living and dead lizards, indicating selection pressure? --- # The Data <img src="t_as_lm_files/figure-html/lizard_load-1.png" style="display: block; margin: auto;" /> --- # Looking at Means and SE <img src="t_as_lm_files/figure-html/lizard_mean-1.png" style="display: block; margin: auto;" /> --- # What is Really Going On? <img src="t_as_lm_files/figure-html/lizard_mean-1.png" style="display: block; margin: auto;" /> -- What if we think of Dead = 0, Living = 1 --- # Let's look at it a different way .center[ 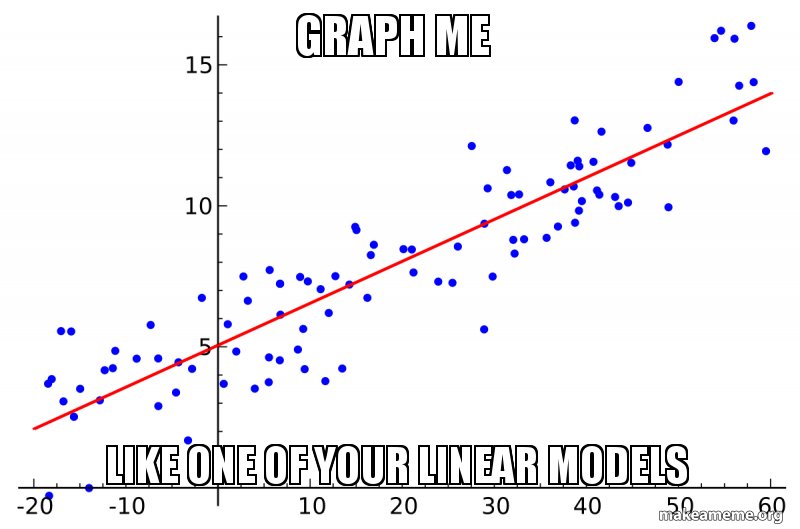 ] --- # This is Just a Linear Regression <img src="t_as_lm_files/figure-html/unnamed-chunk-11-1.png" style="display: block; margin: auto;" /> `$$Length_i = \beta_0 + \beta_1 Status_i + \epsilon_i$$` --- # You're Not a Dummy, Even if Your Code Is `$$Length_i = \beta_0 + \beta_1 Status_i + \epsilon_i$$` - Setting `\(Status_i\)` to 0 or 1 (Dead or Living) is called Dummy Coding - We can always turn groups into "Dummy" 0 or 1 - We could even fit a model wit no `\(\beta_0\)` and code Dead = 0 or 1 and Living = 0 or 1 - This approach works for any **nominal variable** --- # How Do We Analyze This? - T-Test of Coefficients tells you difference between dead and live -- - Wait, did you say **T-Test**? - Yes, we're doing *the same thing* in coefficient evaluation -- - F-tests still useful for looking at variation explained - Also `\(R^2\)` -- - You can even use likelihood, Bayes, CV, and other tools -- - You get more for your money with linear models! --- # Fit and Compare! ```r t_mod <- lm(`Squamosal horn length` ~ Status, data = lizards) ``` Coefficients from Linear Model: <table class="table" style="margin-left: auto; margin-right: auto;"> <thead> <tr> <th style="text-align:left;"> term </th> <th style="text-align:right;"> estimate </th> <th style="text-align:right;"> std.error </th> <th style="text-align:right;"> statistic </th> <th style="text-align:right;"> p.value </th> </tr> </thead> <tbody> <tr> <td style="text-align:left;"> StatusLiving </td> <td style="text-align:right;"> 2.294502 </td> <td style="text-align:right;"> 0.5275497 </td> <td style="text-align:right;"> 4.349358 </td> <td style="text-align:right;"> 2.27e-05 </td> </tr> </tbody> </table> <!-- F-Test <table class="table" style="margin-left: auto; margin-right: auto;"> <thead> <tr> <th style="text-align:left;"> term </th> <th style="text-align:right;"> df </th> <th style="text-align:right;"> sumsq </th> <th style="text-align:right;"> meansq </th> <th style="text-align:right;"> statistic </th> <th style="text-align:right;"> p.value </th> </tr> </thead> <tbody> <tr> <td style="text-align:left;"> Status </td> <td style="text-align:right;"> 1 </td> <td style="text-align:right;"> 132.1908 </td> <td style="text-align:right;"> 132.190759 </td> <td style="text-align:right;"> 18.91691 </td> <td style="text-align:right;"> 2.27e-05 </td> </tr> <tr> <td style="text-align:left;"> Residuals </td> <td style="text-align:right;"> 182 </td> <td style="text-align:right;"> 1271.8101 </td> <td style="text-align:right;"> 6.987967 </td> <td style="text-align:right;"> NA </td> <td style="text-align:right;"> NA </td> </tr> </tbody> </table> --> T-Test <table class="table" style="margin-left: auto; margin-right: auto;"> <thead> <tr> <th style="text-align:right;"> estimate </th> <th style="text-align:right;"> estimate1 </th> <th style="text-align:right;"> estimate2 </th> <th style="text-align:right;"> statistic </th> <th style="text-align:right;"> p.value </th> </tr> </thead> <tbody> <tr> <td style="text-align:right;"> -2.294502 </td> <td style="text-align:right;"> 21.98667 </td> <td style="text-align:right;"> 24.28117 </td> <td style="text-align:right;"> -4.349358 </td> <td style="text-align:right;"> 2.27e-05 </td> </tr> </tbody> </table> --- # Variatons on a theme: Non-Parametric Mann-Whitney U How about those residuals? <table class="table" style="margin-left: auto; margin-right: auto;"> <thead> <tr> <th style="text-align:right;"> statistic </th> <th style="text-align:right;"> p.value </th> <th style="text-align:left;"> method </th> </tr> </thead> <tbody> <tr> <td style="text-align:right;"> 0.9602582 </td> <td style="text-align:right;"> 4.58e-05 </td> <td style="text-align:left;"> Shapiro-Wilk normality test </td> </tr> </tbody> </table> <img src="t_as_lm_files/figure-html/unnamed-chunk-14-1.png" style="display: block; margin: auto;" /> -- Classical approach: Non-Parametric Mann-Whitney-U Test - But, are you really going to remember that? - Simpler to remember, we just transform Y values to ranks, and voila, we have a general technique --- # Signed Rank versus Original Values <img src="t_as_lm_files/figure-html/ranks-1.png" style="display: block; margin: auto;" /> --- # Signed Rank as Data <img src="t_as_lm_files/figure-html/ranks_data-1.png" style="display: block; margin: auto;" /> --- # Signed Rank as Boxplots <img src="t_as_lm_files/figure-html/ranks_boxplot-1.png" style="display: block; margin: auto;" /> --- # Variations on a theme: Welch's T-Test ```r mwu_mod <- lm(rank(`Squamosal horn length`) ~ Status, data = lizards) mwu <- wilcox.test(`Squamosal horn length` ~ Status, data = lizards,) ``` Linear Model on Ranks <table> <thead> <tr> <th style="text-align:left;"> term </th> <th style="text-align:right;"> estimate </th> <th style="text-align:right;"> std.error </th> <th style="text-align:right;"> statistic </th> <th style="text-align:right;"> p.value </th> </tr> </thead> <tbody> <tr> <td style="text-align:left;"> StatusLiving </td> <td style="text-align:right;"> 44.94459 </td> <td style="text-align:right;"> 10.12238 </td> <td style="text-align:right;"> 4.440119 </td> <td style="text-align:right;"> 1.56e-05 </td> </tr> </tbody> </table> Mann-Whitney-U/Wilcoxon Rank Test <table> <thead> <tr> <th style="text-align:right;"> MWU_p_value </th> </tr> </thead> <tbody> <tr> <td style="text-align:right;"> 2.37e-05 </td> </tr> </tbody> </table> --- # Variations on a theme: Welch's T-Test Or.... let variance be different between groups. i = data point, j = group `$$y_{ij} = \beta_0 + \beta_1x_j + \epsilon_{ij}$$` `$$\epsilon_{ij} \sim N(0, \sigma_j)$$` -- Fit using **weighted least squares** - we weight LS by inverse of variance -- Classically, this is known as Welch's T-Test, and is the default for R - Computes a pooled variance based on unequal variance/sample size --- # Weighting by Variance ```r library(nlme) weighted_mod <- gls(squamosal_horn_length ~ Status, weights = varIdent(form = ~1|Status), data = lizards, method = "ML") ``` Weighted Least Squares Results <table class="table" style="margin-left: auto; margin-right: auto;"> <thead> <tr> <th style="text-align:left;"> term </th> <th style="text-align:right;"> estimate </th> <th style="text-align:right;"> std.error </th> <th style="text-align:right;"> statistic </th> <th style="text-align:right;"> p.value </th> </tr> </thead> <tbody> <tr> <td style="text-align:left;"> StatusLiving </td> <td style="text-align:right;"> 2.294502 </td> <td style="text-align:right;"> 0.5331879 </td> <td style="text-align:right;"> 4.303365 </td> <td style="text-align:right;"> 2.74e-05 </td> </tr> </tbody> </table> Welch's T-Test Results <table class="table" style="margin-left: auto; margin-right: auto;"> <thead> <tr> <th style="text-align:right;"> estimate </th> <th style="text-align:right;"> estimate1 </th> <th style="text-align:right;"> estimate2 </th> <th style="text-align:right;"> statistic </th> <th style="text-align:right;"> p.value </th> </tr> </thead> <tbody> <tr> <td style="text-align:right;"> -2.294502 </td> <td style="text-align:right;"> 21.98667 </td> <td style="text-align:right;"> 24.28117 </td> <td style="text-align:right;"> -4.26337 </td> <td style="text-align:right;"> 0.0001178 </td> </tr> </tbody> </table> --- # Don't forget... .center[  ] --- # Excess Baggage - In this framework, you have to do ALL assumption tests -- - BUT, t-tests have THE SAME ASSUMPTIONS -- - BECASUE THEY ARE JUST LINEAR MODELS RE-ARRANGED -- - AND, you gain flexibility in execution -- - AND, you don't have to remember an arcane taxonomy of tests -- `$$\large Y = \beta X + \epsilon$$` --- # Care for Your Golem .center[  Just remember, if you are not careful, even with the simplest data, you can still burn down Prague!] --- class: center, middle 