class: center, middle background-image: url(images/21/blocked_designs/Slide4.jpg) background-size:cover # Many Types of Categories: Multi-Way and Factorial ANOVA --- class: center, middle # Etherpad <br><br> <center><h3>https://etherpad.wikimedia.org/p/607-anova-2020</h3></center> --- class: center, middle  --- # Many Categorical Predictors = Fun! 1. Combining Multiple Categorical Variables 2. Analyzing a Multi-way Model 3. Replicating Categorical Variable Combinations: Factorial Models 4. The Implications of Interaction Effects --- # Effects of Stickleback Density on Zooplankton <br><br> .pull-left[ 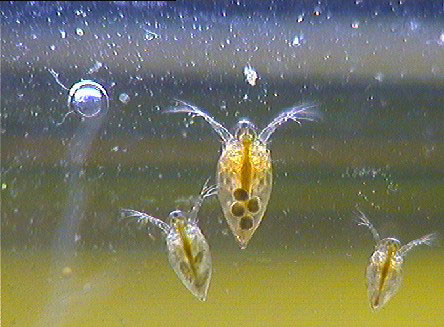 ] .pull-right[ 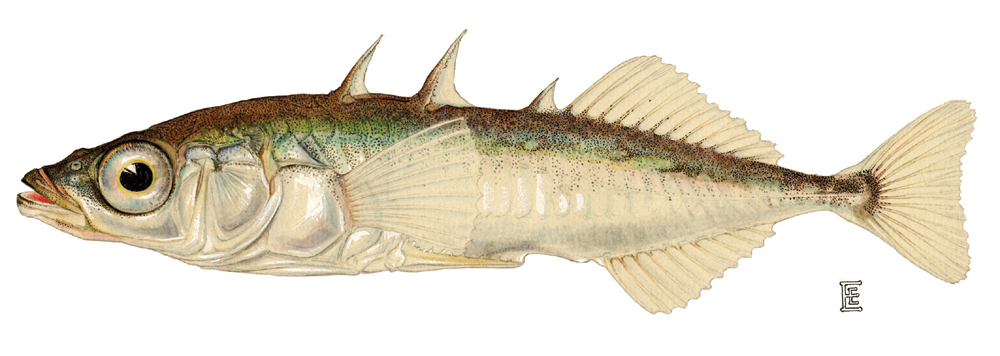 ] --- # More Than One Group with a Randomized Controlled Blocked Design  --- # Effects of Stickleback Density on Zooplankton <br><br> .pull-left[  ] .pull-right[  ] .center[ Units placed across a lake so that 1 set of each treatment was ’blocked’ together ] --- # Effects of Both Treatment and Block <img src="anova_2_files/figure-html/zooplankton_boxplot-1.png" style="display: block; margin: auto;" /> --- # Multiway ANOVA - Many different treatment types - 2-Way ANOVA is for Treatment and block - 3-Way for, e.g., Sticklebacks, Nutrients, and block - 4-way, etc., all possible -- - Assumes treatments are fully orthogonal - Each type of treatment type A has all levels of treatment type B - E.g., Each stickleback treatment is present in each block -- - Experiment is **balanced** for **simple effects** - Simple effect is the unique combination of two or more treatments - Balance implies the sample size for each treatment combination is the same -- - But, we can model even if unbalanced - Just need to adjust on how we evaluate the model --- # Treatment Contrast Model for Multiway ANOVA/ANODEV/BANOVA `$$y_{ijk} = \beta_{0} + \sum \beta_{i}x_{i} + \sum \beta_{j}x_{j} + \epsilon_{ijk}$$` `$$\epsilon_{ijk} \sim N(0, \sigma^{2} )$$` `$$\qquad x_{i} = 0,1$$` `$$\qquad x_{j} = 0,1$$` i = treatment type 1, j = treatment type 2, k = replicate `\(\beta_0\)` = reference treatment combination (i.e, control block 1) -- Or, with matrices, a general linear model... `$$\boldsymbol{Y} = \boldsymbol{\beta X} + \boldsymbol{\epsilon}$$` --- # What does a Multiple Category Model Look like in Data? Data <table class="table table-striped" style="margin-left: auto; margin-right: auto;"> <thead> <tr> <th style="text-align:left;"> treatment </th> <th style="text-align:right;"> zooplankton </th> <th style="text-align:left;"> block </th> </tr> </thead> <tbody> <tr> <td style="text-align:left;"> control </td> <td style="text-align:right;"> 4.1 </td> <td style="text-align:left;"> 1 </td> </tr> <tr> <td style="text-align:left;"> low </td> <td style="text-align:right;"> 2.2 </td> <td style="text-align:left;"> 1 </td> </tr> <tr> <td style="text-align:left;"> high </td> <td style="text-align:right;"> 1.3 </td> <td style="text-align:left;"> 1 </td> </tr> <tr> <td style="text-align:left;"> control </td> <td style="text-align:right;"> 3.2 </td> <td style="text-align:left;"> 2 </td> </tr> <tr> <td style="text-align:left;"> low </td> <td style="text-align:right;"> 2.4 </td> <td style="text-align:left;"> 2 </td> </tr> <tr> <td style="text-align:left;"> high </td> <td style="text-align:right;"> 2.0 </td> <td style="text-align:left;"> 2 </td> </tr> </tbody> </table> --- # What does a Multiple Category Model Look like in Data? Data Prepped for Model <table class="table table-striped" style="margin-left: auto; margin-right: auto;"> <thead> <tr> <th style="text-align:right;"> (Intercept) </th> <th style="text-align:right;"> treatmenthigh </th> <th style="text-align:right;"> treatmentlow </th> <th style="text-align:right;"> block2 </th> <th style="text-align:right;"> block3 </th> <th style="text-align:right;"> block4 </th> <th style="text-align:right;"> block5 </th> </tr> </thead> <tbody> <tr> <td style="text-align:right;"> 1 </td> <td style="text-align:right;"> 0 </td> <td style="text-align:right;"> 0 </td> <td style="text-align:right;"> 0 </td> <td style="text-align:right;"> 0 </td> <td style="text-align:right;"> 0 </td> <td style="text-align:right;"> 0 </td> </tr> <tr> <td style="text-align:right;"> 1 </td> <td style="text-align:right;"> 0 </td> <td style="text-align:right;"> 1 </td> <td style="text-align:right;"> 0 </td> <td style="text-align:right;"> 0 </td> <td style="text-align:right;"> 0 </td> <td style="text-align:right;"> 0 </td> </tr> <tr> <td style="text-align:right;"> 1 </td> <td style="text-align:right;"> 1 </td> <td style="text-align:right;"> 0 </td> <td style="text-align:right;"> 0 </td> <td style="text-align:right;"> 0 </td> <td style="text-align:right;"> 0 </td> <td style="text-align:right;"> 0 </td> </tr> <tr> <td style="text-align:right;"> 1 </td> <td style="text-align:right;"> 0 </td> <td style="text-align:right;"> 0 </td> <td style="text-align:right;"> 1 </td> <td style="text-align:right;"> 0 </td> <td style="text-align:right;"> 0 </td> <td style="text-align:right;"> 0 </td> </tr> <tr> <td style="text-align:right;"> 1 </td> <td style="text-align:right;"> 0 </td> <td style="text-align:right;"> 1 </td> <td style="text-align:right;"> 1 </td> <td style="text-align:right;"> 0 </td> <td style="text-align:right;"> 0 </td> <td style="text-align:right;"> 0 </td> </tr> <tr> <td style="text-align:right;"> 1 </td> <td style="text-align:right;"> 1 </td> <td style="text-align:right;"> 0 </td> <td style="text-align:right;"> 1 </td> <td style="text-align:right;"> 0 </td> <td style="text-align:right;"> 0 </td> <td style="text-align:right;"> 0 </td> </tr> </tbody> </table> --- # Fits **Least Squares** ```r zoop_lm <- lm(zooplankton ~ treatment + block, data=zoop) ``` **Likelihood** ```r zoop_glm <- glm(zooplankton ~ treatment + block, data=zoop, family = gaussian(link = "identity")) ``` **Bayesian** ```r zoop_brm <- brm(zooplankton ~ treatment + block, data=zoop, family = gaussian(link = "identity"), chains = 2) ``` --- # Assumptions of Multiway Anova - Independence of data points - Normality within groups (of residuals) - No relationship between fitted and residual values - Homoscedasticity (homogeneity of variance) of groups - .red[Additivity of Treatments] --- # The Usual Suspects of Assumptions <img src="anova_2_files/figure-html/zoop_assumptions-1.png" style="display: block; margin: auto;" /> --- # Group Residuals <img src="anova_2_files/figure-html/zoop_group_assumptions-1.png" style="display: block; margin: auto;" /> We now want to look at both sets of categories to evaluate HOV --- # Group Residuals Levene Test for Treatment <table class="table table-striped" style="margin-left: auto; margin-right: auto;"> <thead> <tr> <th style="text-align:left;"> term </th> <th style="text-align:right;"> df </th> <th style="text-align:right;"> statistic </th> <th style="text-align:right;"> p.value </th> </tr> </thead> <tbody> <tr> <td style="text-align:left;"> group </td> <td style="text-align:right;"> 2 </td> <td style="text-align:right;"> 0.3315789 </td> <td style="text-align:right;"> 0.7241614 </td> </tr> <tr> <td style="text-align:left;"> </td> <td style="text-align:right;"> 12 </td> <td style="text-align:right;"> </td> <td style="text-align:right;"> </td> </tr> </tbody> </table> Levene Test for Block <table class="table table-striped" style="margin-left: auto; margin-right: auto;"> <thead> <tr> <th style="text-align:left;"> term </th> <th style="text-align:right;"> df </th> <th style="text-align:right;"> statistic </th> <th style="text-align:right;"> p.value </th> </tr> </thead> <tbody> <tr> <td style="text-align:left;"> group </td> <td style="text-align:right;"> 4 </td> <td style="text-align:right;"> 0.4241486 </td> <td style="text-align:right;"> 0.7880527 </td> </tr> <tr> <td style="text-align:left;"> </td> <td style="text-align:right;"> 10 </td> <td style="text-align:right;"> </td> <td style="text-align:right;"> </td> </tr> </tbody> </table> --- # ## Tukey's Test of Non-additivity: - Our model is `\(y_{ij} = \mu + \alpha_i + \beta_j + \epsilon_{ij}\)` -- - But, if A and B are non-additive, results are incorrect. - Our model doesn't have an A*B term -- - We don't have the DF with n=1 per treatment combination to calculate an interaction, so... -- - Assume a model of `\(y_{ij} = \mu + \alpha_i + \beta_j + \lambda\alpha_i\beta_j\)` -- - We can then test for `\(SS_{AB}\)` using `\(\lambda\alpha_i\beta_j\)` --- # Tukey's Test of Non-additivity ``` Test stat Pr(>|Test stat|) block Tukey test 0.4742 0.6354 ``` --- # Many Categorical Predictors = Fun! 1. Combining Multiple Categorical Variables 2. .red[Analyzing a Multi-way Model] 3. Replicating Categorical Variable Combinations: Factorial Models 4. The Implications of Interaction Effects --- # What now? - Which categories are associated with variability in our response? - ANOVA/ANODEV/BANOVA - How much variability are we explaining? - Do we want to compare to simpler models for predictive ability? - Comparison of Means --- # Hypotheses for Multiway ANOVA/ANODEV TreatmentHo: `\(\mu_{i1} = \mu{i2} = \mu{i3} = ...\)` Block Ho: `\(\mu_{j1} = \mu{j2} = \mu{j3} = ...\)` i.e., The variane due to each treatment type is no different than noise --- # We Decompose Sums of Squares for Multiway ANOVA `\(SS_{Total} = SS_{Between A} + SS_{Between B} + SS_{Within}\)` - Factors are Orthogonal and Balanced, so, Model SS can be split - F-Test using Mean Squares as Before - OR we compare y ~ a versus y ~ b to see if y ~ a + b has a higher likelihood - ANODEV LRT - Can also be done with F tests - Useful if data is unbalanced (called **type II comparison**) --- # Put it to the Test ### F-Test <table class="table table-striped" style="margin-left: auto; margin-right: auto;"> <thead> <tr> <th style="text-align:left;"> term </th> <th style="text-align:right;"> df </th> <th style="text-align:right;"> sumsq </th> <th style="text-align:right;"> meansq </th> <th style="text-align:right;"> F </th> <th style="text-align:right;"> p.value </th> </tr> </thead> <tbody> <tr> <td style="text-align:left;"> treatment </td> <td style="text-align:right;"> 2 </td> <td style="text-align:right;"> 6.857333 </td> <td style="text-align:right;"> 3.428667 </td> <td style="text-align:right;"> 16.365951 </td> <td style="text-align:right;"> 0.0014881 </td> </tr> <tr> <td style="text-align:left;"> block </td> <td style="text-align:right;"> 4 </td> <td style="text-align:right;"> 2.340000 </td> <td style="text-align:right;"> 0.585000 </td> <td style="text-align:right;"> 2.792363 </td> <td style="text-align:right;"> 0.1010308 </td> </tr> <tr> <td style="text-align:left;"> Residuals </td> <td style="text-align:right;"> 8 </td> <td style="text-align:right;"> 1.676000 </td> <td style="text-align:right;"> 0.209500 </td> <td style="text-align:right;"> </td> <td style="text-align:right;"> </td> </tr> </tbody> </table> `\(R^2\)` = 0.846 -- ### ANODEV <table class="table table-striped" style="margin-left: auto; margin-right: auto;"> <thead> <tr> <th style="text-align:left;"> term </th> <th style="text-align:right;"> LR Chisq </th> <th style="text-align:right;"> df </th> <th style="text-align:right;"> p.value </th> </tr> </thead> <tbody> <tr> <td style="text-align:left;"> treatment </td> <td style="text-align:right;"> 32.73190 </td> <td style="text-align:right;"> 2 </td> <td style="text-align:right;"> 0.0000001 </td> </tr> <tr> <td style="text-align:left;"> block </td> <td style="text-align:right;"> 11.16945 </td> <td style="text-align:right;"> 4 </td> <td style="text-align:right;"> 0.0247242 </td> </tr> </tbody> </table> --- # AIC Analysis of Alternate Models - the models ```r zoop_only_trt <- lm(zooplankton ~ treatment, data = zoop) zoop_only_block <- lm(zooplankton ~ block, data = zoop) zoop_nuts_matter <- lm(zooplankton ~ I(treatment !="control")+ block, data = zoop) zoop_null <- lm(zooplankton ~ 1, data = zoop) ``` --- # AIC Analysis of Alternate Models - Predictive Ability <table class="table table-striped" style="margin-left: auto; margin-right: auto;"> <thead> <tr> <th style="text-align:left;"> </th> <th style="text-align:left;"> Modnames </th> <th style="text-align:right;"> K </th> <th style="text-align:right;"> AICc </th> <th style="text-align:right;"> Delta_AICc </th> <th style="text-align:right;"> AICcWt </th> </tr> </thead> <tbody> <tr> <td style="text-align:left;"> 2 </td> <td style="text-align:left;"> Only trt </td> <td style="text-align:right;"> 4 </td> <td style="text-align:right;"> 34.80170 </td> <td style="text-align:right;"> 0.000000 </td> <td style="text-align:right;"> 0.9781236 </td> </tr> <tr> <td style="text-align:left;"> 5 </td> <td style="text-align:left;"> Null </td> <td style="text-align:right;"> 2 </td> <td style="text-align:right;"> 42.74210 </td> <td style="text-align:right;"> 7.940404 </td> <td style="text-align:right;"> 0.0184568 </td> </tr> <tr> <td style="text-align:left;"> 4 </td> <td style="text-align:left;"> Nuts or Control </td> <td style="text-align:right;"> 7 </td> <td style="text-align:right;"> 46.49203 </td> <td style="text-align:right;"> 11.690333 </td> <td style="text-align:right;"> 0.0028305 </td> </tr> <tr> <td style="text-align:left;"> 1 </td> <td style="text-align:left;"> All </td> <td style="text-align:right;"> 8 </td> <td style="text-align:right;"> 49.69355 </td> <td style="text-align:right;"> 14.891854 </td> <td style="text-align:right;"> 0.0005710 </td> </tr> <tr> <td style="text-align:left;"> 3 </td> <td style="text-align:left;"> Only Block </td> <td style="text-align:right;"> 6 </td> <td style="text-align:right;"> 56.60710 </td> <td style="text-align:right;"> 21.805405 </td> <td style="text-align:right;"> 0.0000180 </td> </tr> </tbody> </table> --- # How to evaluate effects of each treatment 1. Examine means estimates 2. Evaluate treatment after parcelling out effect of other treatment 3. Evaluate treatment at the median or mean level of other treatment --- # Evaluating Means <table class="table" style="margin-left: auto; margin-right: auto;"> <thead> <tr> <th style="text-align:left;"> term </th> <th style="text-align:right;"> estimate </th> <th style="text-align:right;"> std.error </th> <th style="text-align:right;"> statistic </th> <th style="text-align:right;"> p.value </th> </tr> </thead> <tbody> <tr> <td style="text-align:left;"> treatmentcontrol </td> <td style="text-align:right;"> 3.42 </td> <td style="text-align:right;"> 0.3126766 </td> <td style="text-align:right;"> 10.9378182 </td> <td style="text-align:right;"> 0.0000043 </td> </tr> <tr> <td style="text-align:left;"> treatmenthigh </td> <td style="text-align:right;"> 1.78 </td> <td style="text-align:right;"> 0.3126766 </td> <td style="text-align:right;"> 5.6927826 </td> <td style="text-align:right;"> 0.0004582 </td> </tr> <tr> <td style="text-align:left;"> treatmentlow </td> <td style="text-align:right;"> 2.40 </td> <td style="text-align:right;"> 0.3126766 </td> <td style="text-align:right;"> 7.6756619 </td> <td style="text-align:right;"> 0.0000588 </td> </tr> <tr> <td style="text-align:left;"> block2 </td> <td style="text-align:right;"> 0.00 </td> <td style="text-align:right;"> 0.3737200 </td> <td style="text-align:right;"> 0.0000000 </td> <td style="text-align:right;"> 1.0000000 </td> </tr> <tr> <td style="text-align:left;"> block3 </td> <td style="text-align:right;"> -0.70 </td> <td style="text-align:right;"> 0.3737200 </td> <td style="text-align:right;"> -1.8730599 </td> <td style="text-align:right;"> 0.0979452 </td> </tr> <tr> <td style="text-align:left;"> block4 </td> <td style="text-align:right;"> -1.00 </td> <td style="text-align:right;"> 0.3737200 </td> <td style="text-align:right;"> -2.6757998 </td> <td style="text-align:right;"> 0.0281084 </td> </tr> <tr> <td style="text-align:left;"> block5 </td> <td style="text-align:right;"> -0.30 </td> <td style="text-align:right;"> 0.3737200 </td> <td style="text-align:right;"> -0.8027399 </td> <td style="text-align:right;"> 0.4453163 </td> </tr> </tbody> </table> --- # Parcelling Out Second Treatment <img src="anova_2_files/figure-html/visualize_treatments-1.png" style="display: block; margin: auto;" /> Component-Residual Plots take examine unique effect of one treatment after removing influence of the other. --- # Median Value of Second Treatment <img src="anova_2_files/figure-html/visreg-1.png" style="display: block; margin: auto;" /> --- # Comparison of Differences at Average of Other Treatment <table class="table table-striped" style="margin-left: auto; margin-right: auto;"> <thead> <tr> <th style="text-align:left;"> contrast </th> <th style="text-align:right;"> estimate </th> <th style="text-align:right;"> lower.HPD </th> <th style="text-align:right;"> upper.HPD </th> </tr> </thead> <tbody> <tr> <td style="text-align:left;"> control - high </td> <td style="text-align:right;"> 1.6222387 </td> <td style="text-align:right;"> 0.9075445 </td> <td style="text-align:right;"> 2.312269 </td> </tr> <tr> <td style="text-align:left;"> control - low </td> <td style="text-align:right;"> 1.0123920 </td> <td style="text-align:right;"> 0.3131533 </td> <td style="text-align:right;"> 1.743134 </td> </tr> <tr> <td style="text-align:left;"> high - low </td> <td style="text-align:right;"> -0.6112915 </td> <td style="text-align:right;"> -1.3635940 </td> <td style="text-align:right;"> 0.095609 </td> </tr> </tbody> </table> Can use whatever contrast style you'd like, and can do this for any set of categories --- # Many Categorical Predictors = Fun! 1. Combining Multiple Categorical Variables 2. Analyzing a Multi-way Model 3. .red[Replicating Categorical Variable Combinations: Factorial Models] 4. The Implications of Interaction Effects --- # The world isn't additive - Until now, we have assumed factors combine additively - the effect of one is not dependent on the effect of the other -- - BUT - what if the effect of one factor depends on another? -- - This is an **INTERACTION** and is quite common -- - Biology: The science of "It depends..." -- - This is challenging to think about and visualize, but if you can master it, you will go far! --- # Intertidal Grazing! .center[ 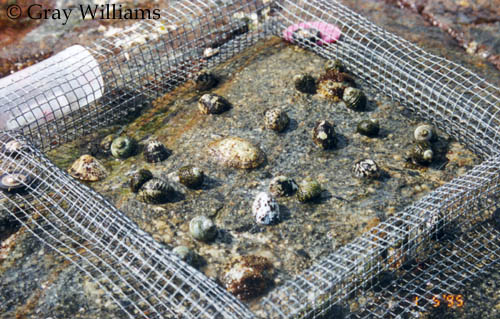 #### Do grazers reduce algal cover in the intertidal? ] --- # Experiment Replicated on Two Ends of a gradient 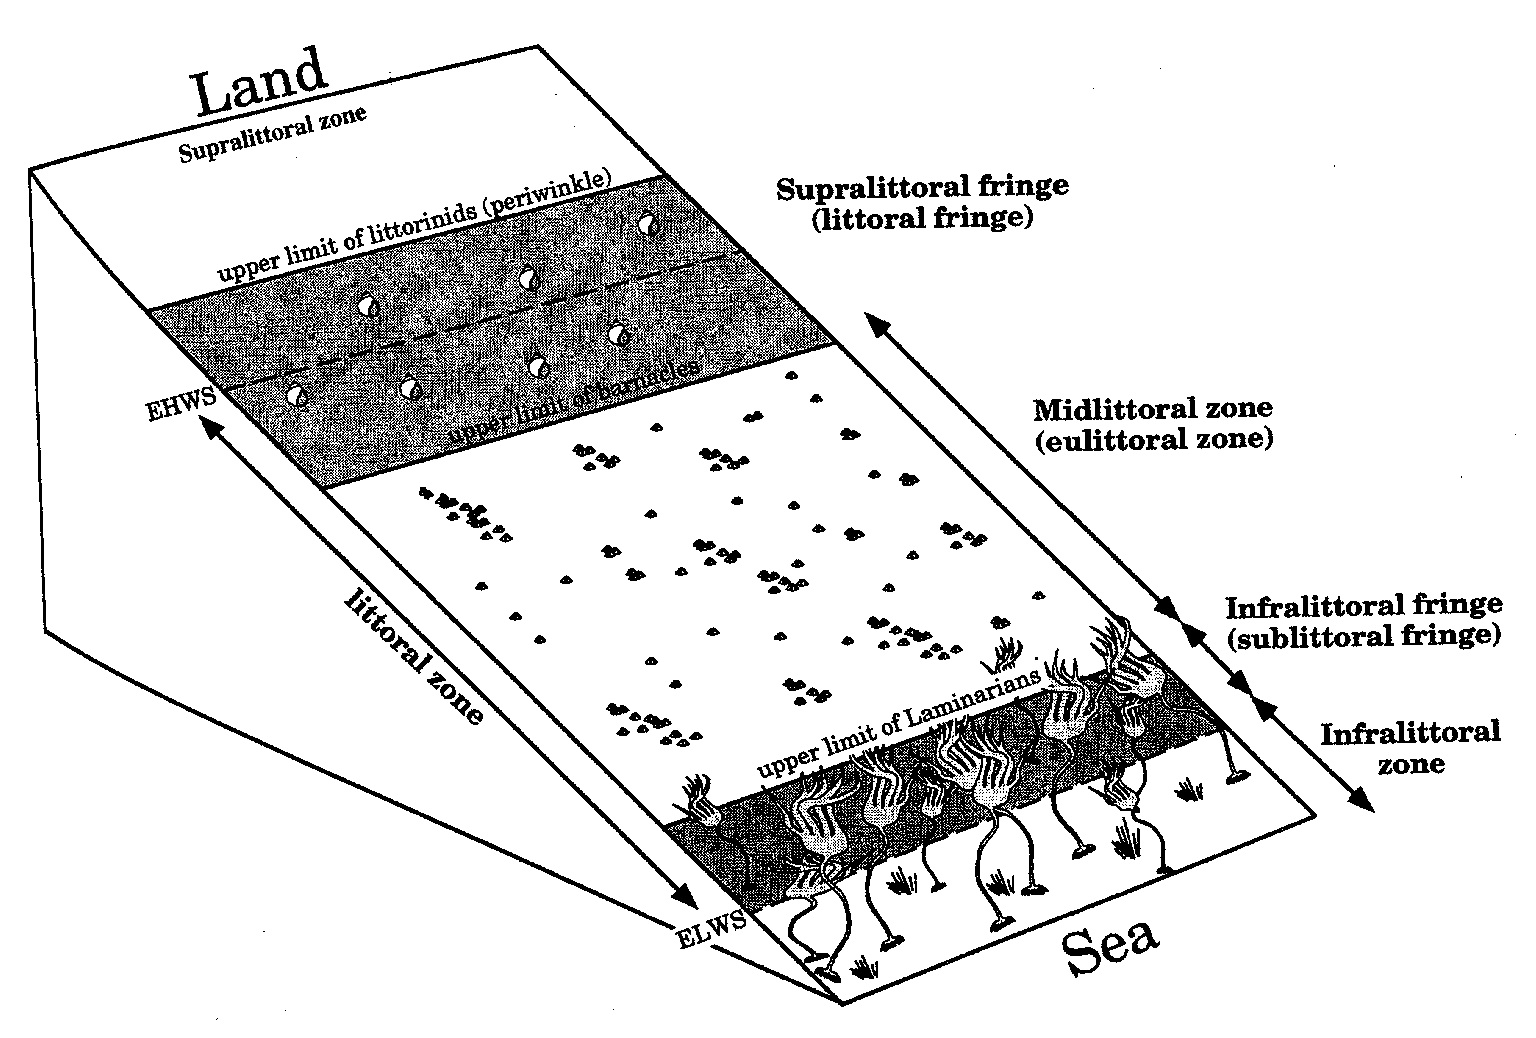 --- # Factorial Experiment  --- # Factorial Design 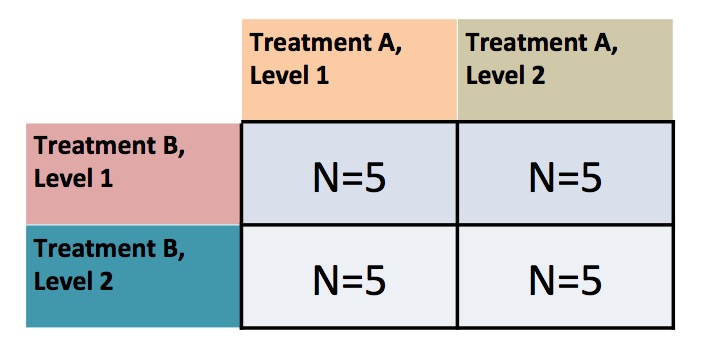 Note: You can have as many treatment types or observed category combinations as you want (and then 3-way, 4-way, etc. interactions) --- # The Data: See the dependency of one treatment on another? <img src="anova_2_files/figure-html/plot_algae-1.png" style="display: block; margin: auto;" /> --- # If we had fit y ~ a + b, residuals look weird <img src="anova_2_files/figure-html/graze_assumptions-1.png" style="display: block; margin: auto;" /> A Tukey Non-Additivity Test would Scream at us --- # A Factorial Model `$$y_{ijk} = \beta_{0} + \sum \beta_{i}x_{i} + \sum \beta_{j}x_{j} + \sum \beta_{ij}x_{ij} + \epsilon_{ijk}$$` `$$\epsilon_{ijk} \sim N(0, \sigma^{2} )$$` `$$x_{i} = 0,1, x_{j} = 0,1, x_{ij} = 0,1$$` - Note the new last term - Deviation due to treatment combination -- <hr> This is still something that can be in the form `$$\boldsymbol{Y} = \boldsymbol{\beta X} + \boldsymbol{\epsilon}$$` --- # The Dummy-Coded Data <table class="table table-striped" style="margin-left: auto; margin-right: auto;"> <thead> <tr> <th style="text-align:right;"> (Intercept) </th> <th style="text-align:right;"> heightmid </th> <th style="text-align:right;"> herbivoresplus </th> <th style="text-align:right;"> heightmid:herbivoresplus </th> </tr> </thead> <tbody> <tr> <td style="text-align:right;"> 1 </td> <td style="text-align:right;"> 0 </td> <td style="text-align:right;"> 0 </td> <td style="text-align:right;"> 0 </td> </tr> <tr> <td style="text-align:right;"> 1 </td> <td style="text-align:right;"> 0 </td> <td style="text-align:right;"> 1 </td> <td style="text-align:right;"> 0 </td> </tr> <tr> <td style="text-align:right;"> 1 </td> <td style="text-align:right;"> 1 </td> <td style="text-align:right;"> 0 </td> <td style="text-align:right;"> 0 </td> </tr> <tr> <td style="text-align:right;"> 1 </td> <td style="text-align:right;"> 1 </td> <td style="text-align:right;"> 1 </td> <td style="text-align:right;"> 1 </td> </tr> </tbody> </table> --- # Fitting **Least Squares** ```r graze_int <- lm(sqrtarea ~ height + herbivores + height:herbivores, data=algae) ## OR graze_int <- lm(sqrtarea ~ height*herbivores, data=algae) ``` -- **Likelihood** ```r graze_int_glm <- glm(sqrtarea ~ height*herbivores, data=algae, family = gaussian(link = "identity")) ``` **Bayes** ```r graze_int_brm <- brm(sqrtarea ~ height*herbivores, data=algae, family = gaussian(link = "identity"), chains = 2) ``` --- # Assumptions are Met <img src="anova_2_files/figure-html/graze_assumptions_int-1.png" style="display: block; margin: auto;" /> --- # Many Categorical Predictors = Fun! 1. Combining Multiple Categorical Variables 2. Analyzing a Multi-way Model 3. Replicating Categorical Variable Combinations: Factorial Models 4. .red[The Implications of Interaction Effects] --- # Omnibus Tests for Interactions - Can do an F-Test `$$SS_{Total} = SS_{A} + SS_{B} + SS_{AB} +SS_{Error}$$` `$$SS_{AB} = n\sum_{i}\sum_{j}(\bar{Y_{ij}} - \bar{Y_{i}}- \bar{Y_{j}} - \bar{Y})^{2}$$` `$$df=(i-1)(j-1)$$` -- - Can do an ANODEV - Compare A + B versus A + B + A:B -- - Can do CV as we did before, only now one model has an interaction - Again, think about what models you are comparing -- - Can look at finite population variance of interaction --- # Example: ANODEV <table class="table table-striped" style="margin-left: auto; margin-right: auto;"> <thead> <tr> <th style="text-align:left;"> </th> <th style="text-align:right;"> LR Chisq </th> <th style="text-align:right;"> Df </th> <th style="text-align:right;"> Pr(>Chisq) </th> </tr> </thead> <tbody> <tr> <td style="text-align:left;"> height </td> <td style="text-align:right;"> 0.3740858 </td> <td style="text-align:right;"> 1 </td> <td style="text-align:right;"> 0.5407855 </td> </tr> <tr> <td style="text-align:left;"> herbivores </td> <td style="text-align:right;"> 6.3579319 </td> <td style="text-align:right;"> 1 </td> <td style="text-align:right;"> 0.0116858 </td> </tr> <tr> <td style="text-align:left;"> height:herbivores </td> <td style="text-align:right;"> 11.0029142 </td> <td style="text-align:right;"> 1 </td> <td style="text-align:right;"> 0.0009097 </td> </tr> </tbody> </table> --- # What do the Coefficients Mean? <table class="table table-striped" style="margin-left: auto; margin-right: auto;"> <thead> <tr> <th style="text-align:left;"> term </th> <th style="text-align:right;"> estimate </th> <th style="text-align:right;"> std.error </th> <th style="text-align:right;"> statistic </th> <th style="text-align:right;"> p.value </th> </tr> </thead> <tbody> <tr> <td style="text-align:left;"> (Intercept) </td> <td style="text-align:right;"> 32.91450 </td> <td style="text-align:right;"> 3.855532 </td> <td style="text-align:right;"> 8.536955 </td> <td style="text-align:right;"> 0.0000000 </td> </tr> <tr> <td style="text-align:left;"> heightmid </td> <td style="text-align:right;"> -10.43090 </td> <td style="text-align:right;"> 5.452546 </td> <td style="text-align:right;"> -1.913034 </td> <td style="text-align:right;"> 0.0605194 </td> </tr> <tr> <td style="text-align:left;"> herbivoresplus </td> <td style="text-align:right;"> -22.51075 </td> <td style="text-align:right;"> 5.452546 </td> <td style="text-align:right;"> -4.128484 </td> <td style="text-align:right;"> 0.0001146 </td> </tr> <tr> <td style="text-align:left;"> heightmid:herbivoresplus </td> <td style="text-align:right;"> 25.57809 </td> <td style="text-align:right;"> 7.711064 </td> <td style="text-align:right;"> 3.317064 </td> <td style="text-align:right;"> 0.0015486 </td> </tr> </tbody> </table> - Intercept chosen as basal condition (low, herbivores -) -- - Changing height to high is associated with a loss of 10 units of algae relative to low/- -- - Adding herbivores is associated with a loss of 22 units of algae relative to low/- -- - BUT - if you add herbivores and mid, that's also associated with an increase of 25 units of algae relative to low/- -- .center[**NEVER TRY AND INTERPRET ADDITIVE EFFECTS ALONE WHEN AN INTERACTION IS PRESENT**<Br>that way lies madness] --- # Let's Look at Means, Figures, and Posthocs .center[.middle[  ]] --- # This view is intuitive <img src="anova_2_files/figure-html/unnamed-chunk-6-1.png" style="display: block; margin: auto;" /> --- # This view is also intuitive <img src="anova_2_files/figure-html/unnamed-chunk-7-1.png" style="display: block; margin: auto;" /> --- # Posthocs and Factorial Designs - Must look at simple effects first in the presence of an interaction - The effects of individual treatment combinations - If you have an interaction, this is what you do! -- - Main effects describe effects of one variable in the complete absence of the other - Useful only if one treatment CAN be absent - Only have meaning if there is no interaction --- # Posthoc Comparisons Averaging Over Blocks - Misleading! ``` contrast estimate SE df t.ratio p.value minus - plus 9.72 3.86 60 2.521 0.0144 Results are averaged over the levels of: height ``` --- # Posthoc with Simple Effects <table class="table table-striped" style="margin-left: auto; margin-right: auto;"> <thead> <tr> <th style="text-align:left;"> contrast </th> <th style="text-align:right;"> estimate </th> <th style="text-align:right;"> SE </th> <th style="text-align:right;"> df </th> <th style="text-align:right;"> t.ratio </th> <th style="text-align:right;"> p.value </th> </tr> </thead> <tbody> <tr> <td style="text-align:left;"> low minus - mid minus </td> <td style="text-align:right;"> 10.430905 </td> <td style="text-align:right;"> 5.452546 </td> <td style="text-align:right;"> 60 </td> <td style="text-align:right;"> 1.913034 </td> <td style="text-align:right;"> 0.0605194 </td> </tr> <tr> <td style="text-align:left;"> low minus - low plus </td> <td style="text-align:right;"> 22.510748 </td> <td style="text-align:right;"> 5.452546 </td> <td style="text-align:right;"> 60 </td> <td style="text-align:right;"> 4.128484 </td> <td style="text-align:right;"> 0.0001146 </td> </tr> <tr> <td style="text-align:left;"> low minus - mid plus </td> <td style="text-align:right;"> 7.363559 </td> <td style="text-align:right;"> 5.452546 </td> <td style="text-align:right;"> 60 </td> <td style="text-align:right;"> 1.350481 </td> <td style="text-align:right;"> 0.1819337 </td> </tr> <tr> <td style="text-align:left;"> mid minus - low plus </td> <td style="text-align:right;"> 12.079843 </td> <td style="text-align:right;"> 5.452546 </td> <td style="text-align:right;"> 60 </td> <td style="text-align:right;"> 2.215450 </td> <td style="text-align:right;"> 0.0305355 </td> </tr> <tr> <td style="text-align:left;"> mid minus - mid plus </td> <td style="text-align:right;"> -3.067346 </td> <td style="text-align:right;"> 5.452546 </td> <td style="text-align:right;"> 60 </td> <td style="text-align:right;"> -0.562553 </td> <td style="text-align:right;"> 0.5758352 </td> </tr> <tr> <td style="text-align:left;"> low plus - mid plus </td> <td style="text-align:right;"> -15.147189 </td> <td style="text-align:right;"> 5.452546 </td> <td style="text-align:right;"> 60 </td> <td style="text-align:right;"> -2.778003 </td> <td style="text-align:right;"> 0.0072896 </td> </tr> </tbody> </table> -- .center[**That's a Lot to Drink In!**] --- # Might be easier visually <img src="anova_2_files/figure-html/graze_posthoc_plot-1.png" style="display: block; margin: auto;" /> --- # We are often interested in something simpler... <img src="anova_2_files/figure-html/graze_posthoc_plot2-1.png" style="display: block; margin: auto;" /> --- # Why think about interactions - It Depends is a rule in biology - Context dependent interactions everywhere - Using categorical predictors in a factorial design is an elegant way to see interactions without worrying about shapes of relationships - BUT - it all comes down to a general linear model! And the same inferential frameworks we have been dealing with since day 1 --- # Final Thought - You can have 2, 3, and more-way interactions! .center[.middle[  ]]