class: center, middle background-image: url(images/01/Sonoma_coast.jpg) background-position: center background-size: cover # .large[Introduction to Computational Data Analysis for Biology] ## .center[2020 Edition] ### .center[Jarrett Byrnes] UMass Boston https://biol607.github.io/ --- class: center # Why are we here?  --- # Some zoom ettiquite - If you *can*, keep your cameras on. I rely on your facial feedback! - But if you don't want to, are eating, are being bodyslammed by toddlers, are at another job, just got out of the shower, etc. *THAT IS FINE* - As I'm usually full screen, so, to ask questions, chat - it flashes in my screen! - You can also PM Michael at any time. - Extra credit for fluffs - We will also use Etherpad for communication (next slide!) - I will record all classes and labs if you cannot make it --- # Who are You? 1. Name 2. Lab 3. Brief research description 4. Why are you here? -- .center[Write it here: https://etherpad.wikimedia.org/p/607-intro-2020] --- # Course Goals 1. Learn how to think about your research in a systematic way to design efficient observational & experimental studies. <br><br> -- 2. Understand how to get the most bang for your buck from your data. <br><br> -- 3. Make you effective collaborators with statisticians. <br><br> -- 4. Make you comfortable enough to learn and grow beyond this class. --- # What are we doing here? ## Course divided into blocks -- 1. Introduction to computation and reproducibility -- 2. Regression and Inference -- 3. Causal Inference -- 4. Further Adventures in Regression -- 5. ??? --- # Block 1: Computation ```r # Load the library #### library(ggplot2) # Load the data #### eelgrass <- read.csv("./data/15q05EelgrassGenotypes.csv") # Plot #### ggplot(eelgrass, aes(y = shoots, x = treatment.genotypes)) + geom_point() + stat_smooth(method = "lm") + theme_classic(base_size = 17) + labs(x = "No. of Genotypes", y = "No. of Shoots per sq. m.") ``` -- .center[.large[.red[Coding is power!]]] -- .center[.large[.red[Code Forces You to Be Explicit About Biology]]] --- class:center # Block 1: Reproducibility  --- class:center # Avoiding The Replication Crisis  --- # Block 2: Regression <img src="01_intro_x_files/figure-html/plot_eelgrass-1.png" style="display: block; margin: auto;" /> --- # Block 2: Inference .center[] - What is the probability of a hypothesis? - Is variation explained by a driver of interest? - Do drivers of interest differ from a null or other expectation? - How can we generalize from our models to the world? --- class:center # Block 3: Causal Inference  --- # Block 3: Causal Inference & Experiments  --- # Block 4: Further Adventures 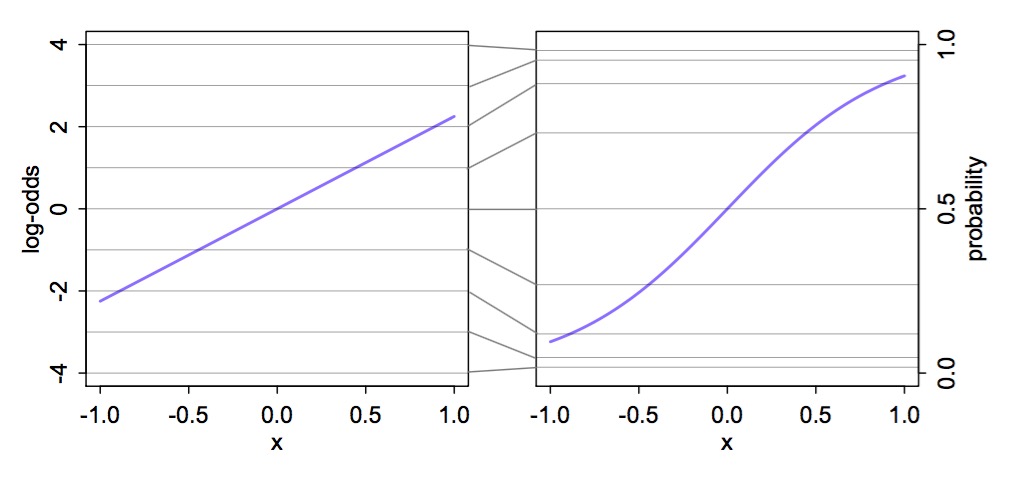 -- .large[.center[Don't worry! It's all just a line!]] --- class:center # Block 5: ???  --- # Lecture and Lab - T/Th Lecture on Concepts - Paper Discussion, Shiny Apps, etc. - Please bring your most interactive self! - I have a tablet, so, I can sketch concepts, etc! - F Lab - Live coding! - I will screw up - don't take me as gospel! - Be generous with feedback/pace comments - Invite your friends! --- # Yes, Lectures are Coded R Markdown sometimes with Reveal.js or Xarnigan .center[<img src="images/01/lecture_code.jpg">] http://github.com/biol607/biol607.github.io --- class: center # Readings for Class: W&S <img src="images/01/whitlockSchluter.jpeg"> .left[Whitlock, W.C. and Schluter, D. (2020) The Analysis of Biological Data, 3rd Edition.] https://whitlockschluter3e.zoology.ubc.ca/ --- class: center # Readings for Class:<br>Wickham & Grolemund  .left[Grolemund, G., and Wickham, W. 2016. R for Data Science.] http://r4ds.had.co.nz --- class:center # There will be memes  -- .large[Extra credit for feeding my #statsmeme addiction] --- # Quizes - Before and/or After Class - Measures understanding - and attendance! - Will drop lowest two - 10% of your grade --- # And Now, A Pop Quiz! <br><br><center> <div style="font-size: 2em;font-weight: bold;">http://tinyurl.com/firstPopQuiz</div> </center><br><br> --- # Problem Sets - THE MOST IMPORTANT THING YOU DO - 40% of your grade - "Adapted"" from Whitlock and Schluter - Will often require R - Complete them using Rmarkdown - Submit via Dropbox or Github --- # Midterm - Advanced problem set - 20% of your grade - After Regression --- # Final Project - Topic of your choosing - Your data, public data, any data! - Make it dissertation relevant! - If part of submitted manuscript, I will retroactively raise your grade - Dates - Proposal Due Oct 9th - Presentations on Dec 11th - Paper due Dec 18th (but earlier fine!) - 30% of your grade --- # Extra Credit 1: Use Github .center[] - This whole class is a github repo - Having a github presence is becoming a real advantage - So.... create a class repository! - folder for homework, folder for exams, folder for labs - If you submit a link to your homework in a repo, +1 per homework! - There will be a github tutorial outside of class hours? --- # Extra Credit 2: Be Nate Silver (before the general election) .center[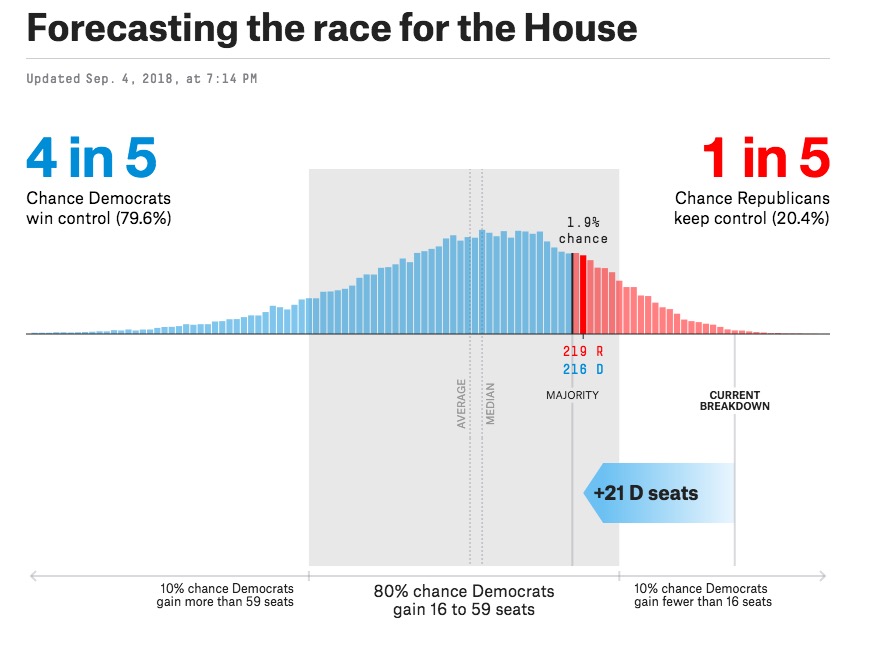] - Submit your forecast with code! - 5 points for getting the correct answer - 5 extra points for explicitly stating the confidence of your estimates - 5 points for a clear explanation of the methodology - 1 point for each thing you do beyond a weighted average of polls - Applied to exam --- Extra Credit 3: Livin' La Vida Data Science - Check out http://www.r-bloggers.com/ and https://rweekly.org/ - Listen to podcasts like https://itunes.apple.com/us/podcast/not-so-standard-deviations/ - Start going to local R User Groups like https://www.meetup.com/Boston-useR/ - Follow data science greats on Twitter (see https://twitter.com/jebyrnes/lists/stats-r-on-twitter) - +1 point per cool thing you bring up in the beginning of each class or on the UMBRug slack --- # Extra Credit 4: Help your fellow students  - Having a problem during homework/exam/etc? - First, try and solve it yourself (google, stackoverflow, etc.) - Post a REPRODUCIBLE EXAMPLE to our slack channel - +1 for answering before I do! - Will constitute a separate pool of EC at end of semester --- # Extra Credit 5: Master of the Tidyverse .center[] - Write an R package, get a full grade bump - Yeah, I said it - See the [http://github.com/covid19R](covid19R project), perhaps? --- # Welcome! <br><br> .center[.middle[]]